How Competitive Intelligence Lets You Stay Ahead of Your Rivals

Businesses don’t exist in a bubble. Competitors always try new tactics to gain market share, leaving you behind. That’s why performing competitive intelligence isn’t optional these days but a must. This guide will walk you through the details of competitive intelligence, from basic definitions to actionable strategies explaining how to perform it and gain the upper hand.


Imagine, if you will, that you’re a baseball player who’s up to bat.

You’ve no idea what pitch the pitcher is going to throw.

You’ve got no clue where the catchers are planning to move to.

All you can do is make your best guess, right?

Well, not exactly. Each pitcher has their preferred throws, and there’s a good chance they’ll use one that they think you’re weak to. If you prepare for such a pitch, you’re more likely to score a home run ????. 

In a way, the world of business is just like the game of baseball. Being able to predict what’s going to happen next will give you a huge advantage. You’ll be able to see your competitors’ latest moves to try and squeeze you out of the market and counteract them.

That, quite simply, is competitive intelligence. 

What is competitive intelligence?

Competitive intelligence is data collection and analysis by your organization on its competitors. This is done using openly-available sources, such as:

  • Press releases.
  • Patent filings.
  • Whitepapers. 
  • And more, which we’ll cover later on.

Public companies are much easier to gather data on, as they are lawfully required to publish their quarterly earnings. Private companies are a little bit more difficult to examine, but there are methods you can use. Legal ones, that is.

Competitive intelligence vs. industrial spying

When we say competitive intelligence, you might think that you’ll be aiming right for the target and getting ahold of your competitors’ strategies directly. 

This is not actually the case.

You see, competitive intelligence is done legally

Every business has a right to keep its inner workings a secret, especially concerning its information. Stealing that information is highly illegal as it would involve either breach of contract or hacking into their servers.

Information gathered illegally can, of course, be used to make decisions, but that’s not competitive intelligence – it’s industrial espionage, which we strongly discourage.

How do you get competitive intelligence?

Competitive intelligence has many sources.

Which ones you turn to will largely depend on your intentions when performing your research. Nevertheless, all of them can provide valuable data if analyzed correctly.

Blog content

The content that your competitors write about on their blogs is a gold mine of information. Not only does it tell you what type of consumer they’re hoping to attract, but how they’re hoping to attract them.

Just like our blog, you’ll find a variety of topics based around the general market that your rivals are in being written and posted. Some of them might seem to have little relevance, but when you analyze them fully, you’ll find ways in which they link back to your competitors’ game plans.

We wouldn’t be writing about competitive intelligence here at Revuze if our software couldn’t help in that regard, now would we? Our AI can help you obtain competitive intelligence in real-time, so feel free to book a demo if you’d like to learn more.

Social media

Social media often has a news component for businesses, whereby they keep their stakeholders updated with their new and ongoing dealings.

Thanks to this, they’re prime information sources. New product launches, new deals, and customer responses, you can find a lot of data on these platforms.

You might think that a lot of social media information can only be used in reactive responses rather than proactively, and in a sense, you’re both right and wrong. 

You can only respond to each individual piece of information, however, they may reveal a trend that shows your competition’s ongoing strategies.

Take, for instance, the example below from Nestle.

Taken individually, each advertisement gives off a different message. The first one showcases the benefits of plant-based food, the second promotes involving children in your cooking.

When looked at together, they tell a different story. Nestle is promoting healthy eating, presumably because they want to boost sales of their healthy eating product lines. This is a bold new direction for a company known mostly for its chocolate and confectionary sales.

Reviews & feedback

Whenever your rivals launch new products or services, the first thing you should look at is their reviews. 

Not only will they give you insight into what your competition is trying to achieve, but they’ll tell you the audience’s response to it.

There’s no use creating the perfect egg scrambler if your customers want their eggs fried, after all.

Reviews are useful for existing products too, with any changes reflected in the feedback they receive. 

Job boards

While not the most intuitive of places to look, job boards can nevertheless be a valuable source of information.

Imagine for a second that your main rival has suddenly posted a lot of job openings in their R&D department. This is pretty unusual since they typically have a low personnel turnover rate.

So what’s going on? Well, there are several options:

  • They’re looking to expand their R&D department permanently.
  • They’re starting an experimental project which they aren’t sure will succeed.
  • They’re feeling behind on their research and want to hire more staff to catch up.

In the case of the first option, the job listings would be permanent posts. In the case of the other two, they’d likely be temporary. 

The second option might also be listed as “temporary with a possibility of becoming permanent.”

Just like that, simply by keeping an eye on the job boards, you’ve gained valuable information on what your rival is up to.

Financial statements

As mentioned previously, public companies have to release their financial statements quarterly. With this data in hand, you can see:

  • Where they’re earning the most money, in essence, what areas they rely on.
  • Where they’re earning more money than last quarter, therefore growing their operations.
  • Where they’re investing their money, what they’re buying, and what they’re not.
  • Which strategies of theirs are working, and which aren’t.

Press releases

Business news is absolutely full of valuable information. There will be announcements about new products, new hires, expansion moves, and more.

Some businesses even have a News section on their websites or apps, which coalesces all this information in one place.

Local information

If you’re part of an industry that has brick-and-mortar stores, you can look at the local information surrounding said stores in order to gather information.

What times do your competitors open and close? What area of the town or city are they located in? Do they have a decent amount of floor space dedicated to customers? Do they keep their stock on hand in a back room or a nearby warehouse?

All these little details can tell you what might and might not work in your own stores. Of course, copying your rivals exactly isn’t ideal as they might be constrained by circumstances and not able to operate as they would ideally, but it’s a start.

Legal papers

You can look at legal papers filed by your competitors as they are typically publicly viewable. 

For instance, a planning permission request for a large industrial building would indicate that your competitor plans to build a new manufacturing plant or similar establishment.

This tells you that your competitor is trying to expand their manufacturing processes, and if it’s in a new location, you can assume that they’re trying to expand into a new market.

Another great source of information is patent filings. These will tell you not only what your competition is doing but what they plan to make legally exclusive. 

It’s sometimes said that there’s not an original thought under the sun that someone hasn’t already had at one point. That’s true in R&D as well. 

You might have to end up abandoning your projects or adjusting them not to break copyright law if your competitors patent what you’ve been working on.

Industry conferences

Conferences are similar to news reports, except more detailed. They’re designed to showcase all of the best aspects of a business to others within their industry, whether that’s to attract new customers or collect new talent.

Conferences are often the most detailed sources of information on this list, and that’s for one simple reason. You can actually talk to participants and get their opinions and perspectives.

All news, legal papers, and social network content are heavily moderated by those who release the information. When talking to someone face to face, you can often get far more information.

The downside is the unorganized nature of gathering data at conferences. You also have to factor in the ability to get to the conference, accommodation, etc. 

So are conferences worth it to attend? It’s up to you, but we’d say definitely. The rise of virtual conferences is also making attendance easier, so keep an eye out for these opportunities.

What are the goals of competitive intelligence?

So, you might be thinking, why use competitive intelligence? 

If it’s all indirect information, is it really going to give me an accurate picture of what my competition is up to?

Competitive intelligence is akin to following footprints in the sand. You might not be there to see the person walk it, but you can see which direction they’re going in, and when they shift or double back on themselves.

You can infer a great deal from indirect information. If you want an example from history, look no further than when Kodak accidentally discovered the Manhattan Project, simply by noticing that they were getting reports of radioactively-contaminated film in the area around the test site.

Anticipating your competitor’s moves

“Know thy enemy, and know thyself,” said Sun Tzu in the Art of War.

While not quite a battle between armies, business is no less competitive. If you know your rivals’ moves before they begin, you will be able to counter them with great effect.

Let’s say that both you and your competitor are in the e-commerce business. 

You know from experience that your competitor has put on a Black Friday sale every year, thus you can anticipate that they’ll do the same this year and develop a strategy that accounts for this.

There’s also the option to take a look at their past sales, as well as current hot items, which will give you a clue as to which products they might put on sale this year. If you know which categories they plan to target, you can sidestep or counteract them.

All in all, the best way to counter an opponent’s strategy is to never let it get off the ground in the first place.

Driving your innovation

You always need innovation in order to keep your business fresh and on top of things. This goes doubly so for those dealing with the ecommerce market, where trends and habits change faster than anywhere else.

Competitive intelligence can uncover what it is that your competition has, but more importantly, it can also reveal what they lack and what consumers are after. No one can cover all bases, after all, and by keeping an eye on new opportunities, you can really get ahead in the game.

Keeping track of market conditions

Markets change, and you need to change with them in order to survive.

One of the greatest examples of decision-making in business is Netflix, which in 2007 launched a streaming service alongside its video rental one. This proved a huge hit and allowed Netflix to become the giant that it is today.

Netflix saw which way the wind was blowing as music consumers turned more and more to digital media and decided to follow it. It allowed them to survive a major upheaval in the industry, which many, including Blockbuster, did not. 

Netflix’s changes showcase a great example of strategic intelligence in action. Video rental was still popular back in 2007, after all, and they could simply have stuck to it. 

Instead, they took account of trends that showed a shift towards online streaming and were able to adapt and weather the storm. 

Blockbuster, on the other hand, continued to have faith in their traditional methods and failed to take into account the long-term implications. There’s only one Blockbuster left in the US now, and for a good reason.

Growing your brand to customer expectations

Times change, and so do people. Nobody would say that applying the same business tactics that worked in the 1950s is appropriate in today’s world, but few realize just how fast expectations can change in the age of the internet.

This is something that e-commerce-based businesses especially need to be aware of, what with the internet being an ever-evolving pace. 

Payment options, fonts and colors, images – especially if you try to use internet humor to sell your brand – links and plugins, all these can have a massive effect on your ability to sell. 

If you use unusual plugins, for instance, you’ll turn off most customers who won’t want to install one to use your store. 

If you’re given the option between two sites, one of which requires you to download extra features to use while the other is free of such inconveniences, which would you choose to use?

Links can also break or be archived over time, meaning what worked perfectly one day won’t the next. Relying on other websites to grant information is a tricky business.

If a certain brand that you’re displaying prominently has bad press, you may want to decrease its visibility on your store lest you get a bad reputation by association. Conversely, you can increase the visibility of other brands that have a surge in popularity.

Competitive intelligence will help here, telling you what customers expect from you and what you need to do in order to meet those expectations. 

A good example of growth meeting customer expectations is Amazon’s adoption of Venmo as a payment option, allowing those who don’t want to use their bank accounts directly a more secure way to pay.

Credit and debit card fraud has been on the rise over the past few years, making more and more consumers wary of using their cards online. 

When using Venmo, your bank information is never directly given to the vendor, meaning that phishing attacks or breaches in Amazon’s security are unlikely to put consumer data at risk.

The COVID-19 pandemic showed just how fast brands needed to be able to change to survive, with plenty of businesses not making it through 2020 intact. 

While not exactly a typical event where markets are concerned, it does nevertheless highlight how much circumstances can change in short periods of time.

Knowing your position within the market

Another great example of where competitive intelligence can help you is in finding your market position. 

You see, it isn’t always obvious from sales figures and other such indirect data exactly where you stand nor how you are perceived by the consumer base.

Data sources such as reviews, ratings, etc., can give you an insight into the consumers’ minds and how they perceive your brand, letting you assess your standing. 

Are you seen as a first-pick, top-rate seller? Are you just a reliable alternative when the usual options aren’t available? Or are you seen as someone niche who fulfills specific demands that only a few consumers would have?

By using this information and comparing it to your strategies, you can see if you’ve achieved your targeted market position. If you have, great! If not, you’ll gain insight into why this is the case and how you might resolve that in the future. 

Remember, Spotify was able to alter its position from merely a simple music player to a content creation platform in just a few years, proving that anything is possible if you have the right intelligence.

Staying ahead of your rivals

Let’s go back to the baseball metaphor. Your biggest rival has started upping their game by purchasing new players specifically to beat you. 

You can’t stop them from doing this as the people selling the players aren’t going to stop just because you ask nicely. So, what can you do?

Well, there are several ways in which you can undermine them, all above board.

For starters, you can either coach your team in strategies that counteract theirs, or you can hire new players yourself to counteract their changes. 

If one pitcher they obtain is known for their difficult-to-hit fastballs, you can hire a hitter who’s known for being able to knock them out of the park.

Secondly, you can put in bids yourself. 

Not only can you stop your rival from obtaining certain players that way, but by entering into bidding wars with them, you can potentially limit the number of players they can buy. 

An organization only has so much money to throw around, after all.

Following on from that, if you take a look at their team and the players they’re placing bids on, you might be able to see dazzling combinations that would work very well together and disrupt them. 

For instance, if you split up a pitcher-catcher combination that is known for doing great together, you can disrupt their seamless play by having their players have to adjust to each other.

In short, just because your competition plans for something to happen doesn’t mean that they will be able to pull it off.

Helping decision making

Finally, we get to the main point that underlies most use of competitive intelligence, that it helps you decide what to do next.

All of the previous examples we’ve mentioned today allow you to make better choices, ultimately helping you make data-driven decisions that will elevate you in the market. 

The more information you have, the better a decision you will be able to make.

If the British had known that Washington planned to cross the Delaware, they wouldn’t have simply let him slip through their fingers. 

Knowledge is power and some would say knowing your competitors is a superpower.

Types of competitive intelligence

Now that we’ve mentioned why you want to use competitive intelligence, it’s time to take a look at what it is in more depth. 

We’ll start by defining the two types, strategic and tactical.

Strategic intelligence

Strategic intelligence is all about long-term thinking. It’s information that could affect the business’ direction over long periods of time. 

This type of intelligence isn’t something that you need to worry about right away. However, you shouldn’t let yourself be lulled into a false sense of security.

Some examples of strategic intelligence include how consumers use the internet, for instance, which social media sites they use, which plugins are considered essential, and which browsers are in favor. 

Tactical intelligence

Tactical intelligence deals with things that alter your plans in the short term.

This type of intelligence demands an immediate response if you’re going to act on it, and in some cases, you may have to act without having the complete picture. 

That said, you shouldn’t let that stop you from making a decision. 

In business, it’s often best to make a decision with the information that you currently have rather than miss the opportunity.

Examples of tactical intelligence include new product launches by competitors, new government regulations being introduced, new stores being opened in your area, and disrupted supply chains due to road accidents.

How do you perform competitive intelligence analysis?

If you’ve read this far, you’re probably convinced that competitive intelligence is the right type of analysis for you. 

So, how do you go about performing it? We’ve laid out the seven crucial steps below that will assist you in undertaking your analysis.

Decide what you want to achieve

The first step, as with many a project, is to determine what exactly it is that you want to achieve with this analysis.

Do you want to know your position within the market? Perhaps you’d like more information on what your rivals are up to? Or maybe you’d like to scour the market for a gap that you can fill?

Your aims will determine everything, from your information sources to your analysis methods. If you don’t make a firm decision here, you’ll be floundering about during the entire process.

Remember, your business will likely have several different markets that it stretches into. By segmenting your analysis into different sections for each market, you’ll be able to collect data that’s relevant to each without muddying the waters.

The narrower your field, the more precise your information will be.

Identify your competitors

Once you know what you aim to achieve, you can then identify your competitors. These are those businesses who are:

  • Within your market.
  • Selling similar products.
  • Aiming to appeal to the same audience.
  • Able to take away your customers.

This is a fairly straightforward step in most cases since you can simply look at who is selling similar products or services to you. The more similar these are, the more they are a direct competitor.

Determine the data you need to collect

Now that you know what information you want to find, and who you want to find it on, it’s time to determine what data will showcase that information.

Are you looking for information on new products that your rivals are launching? Look to reviews, your rivals’ websites, and unboxing videos.

Do you want to know what your competition is up to with their advertising? You need to look at their campaigns and observe the trends.

You can be more specific too, splitting advertisement into online and offline, email and social media, etc. Remember, the more segmented the data, the more precisely you can guess your opponents’ moves.

Find your data sources

Once you’ve determined the data you want to collect, you can pick your data sources. 

Products? Find their reviews, look at their product showcases, and check out the product’s sentiment via sentiment analysis

You can even go so far as to buy one of their products for more direct comparison and testing, and maybe find a way to get an edge that way.

Pricing strategies? Take a look at price trends offered by Amazon, at past offers and pamphlets, and compare them to your own.

SEO tools such as Semrush and Ahrefs will give you detailed information on a variety of topics, as they’ll easily be able to show you which keywords your competitors are aiming to rank strongly in. 

If you know where they’re trying to appear in Google searches, you’ll know what kind of customers they’re aiming to attract.

Analyze your data

Next up is data analysis. There are plenty of methods to choose from, some involving software and some involving doing the number crunching yourself. 

Some examples include but aren’t limited to:

  • Porter’s Five Forces.
  • Driving Forces Analysis.
  • Product Life Cycles.
  • Porters Four Corners.
  • SWOT Analysis.

Remember, while computers might be all the rage, they’re a little lacking when it comes to the emotional side of things. 

Sometimes you can simply look at the information you’re presented with and come to a better conclusion than a computer could ever reach.

Convert your analysis into plans of action

Now that you’ve gained your information, it’s time to convert it into plans of action. Or rather, factor it into your existing plans to make them better.

To take the previous baseball metaphor, you need to adjust your stance once you’ve deduced what pitch you’re about to face. In the case of business, however, the pitch is anything that can alter the ideal outcome of your plans.

The direction that you take is extremely dependent on your situation, so for the most part it’s up to you. Your intuition and experience can be excellent tools here, allowing you to see solutions that wouldn’t ordinarily be obvious.

Repeat, repeat, repeat

Competitive intelligence isn’t just a one-and-done type of deal. Your strategies change, so why shouldn’t your competitors do the same? 

Competitive intelligence should be a regular habit that you indulge in, not a one-off project. 

After all, markets are volatile, consumer expectations change, and you need to be aware of all of this if you want to get ahead in the game.

When should you perform competitive intelligence analysis?

As we’ve previously mentioned, competitive intelligence analysis is something that’s ideally done whenever possible. 

However, there are a few specific times in your business’s life cycle that you definitely need to be performing it.

Let’s take a look at some of the best points in time when you can be undertaking this.

When you’re starting out

Analyzing your competition should be one of the first things you do when you’re planning to start a business. Knowing who you’re up against, what they do, and how they do it is crucial to staying competitive.

Understanding the industry you’re in will tell you a great deal about how you should operate. 

Is the market saturated with brands that seem indistinguishable? You’ll need to stand out by having a feature that’s unique. 

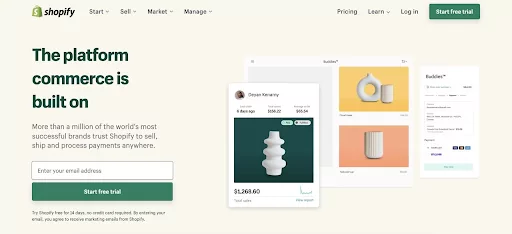
Shopify, for instance, saw the world of ecommerce and decided to create a platform for small businesses to create their own customized online stores easily, rather than having to rely on pre-existing platforms that would limit their design abilities.

Your investors will want to know about the surrounding market too since it gives them an insight into how well you’re likely to perform and how risky an investment you are. 

Very few businesses can get off the ground without funding, so this is a top priority.

When you’re developing & launching a new product

William Henry Perkin isn’t likely a name that you know, since he lived in the 1800s. In short, he’s best known for creating the first cheap purple dye, which until those times had been limited to the extremely rich due to the cost of its production.

He also created a red dye in 1869. However, another company beat him to the punch in patenting it by just a single day! 

This showcases why you need to perform competitive intelligence both when developing and launching a new product – your rivals might be thinking along similar lines and get their product out before yours, at which point you may have to abandon the entire project due to patenting.

When you’re considering a change in market strategy

Change comes to us all, whether we like it or not. A crucial part of planning for change is analyzing the current market in order to assess whether or not your planned changes will be effective.

One of the most important parts of this is analyzing your competitors in order to make sure they’re not planning the same as you. 

After all, it’s no good to plan a pivot that makes you stand out only for your competition to take the same direction. 

When you’re seeing a drop in physical business activity

When business stagnates, there isn’t always an obvious reason why meaning you need to look deeper to find the source of your problems.

Of course, foot traffic and physical sales can decrease for reasons other than your competition, but by analyzing them, you can see whether they are stealing your customers or if there’s a bigger problem that you all are facing.

Are you all seeing a drop in foot traffic, but only within a specific area of your city? It’s probably a transportation issue that prevents customers from being able to reach you easily.

Maybe some of your competitors are seeing a boom, whereas others are seeing a bust also. There will be some correlating reasons as to why specific businesses are more attractive right now compared to others, and you will be able to find them.

Maybe everyone sees a drop in business activity. This points to a drop in consumer confidence, indicating that you should be prepared for them to spend less and spend only on products they really desire.

All this information adds up to an edge that lets you see where consumers are engaging with businesses and, more importantly, why. This enables you to adjust your approach and meet their expectations.

When you’re seeing a drop in online traffic

Getting hits on your website is crucial to ecommerce, and a big part of this is search engine optimization to account for organic searches, which are making up a larger and larger share of online traffic. 

In essence, hitting the right keywords within your website and meta information makes sure that you’re at the top of the list when it comes to Google searches in your particular field.

The problem with this is two-fold. 

First, the inner workings of search engine rankings are secret and will naturally change over time. 

Secondly, the searches that consumers perform will change over time as their needs and wants evolve.

Both of these factors add up to one single outcome – you need to keep on top of your optimization to stand out. 

If you see a drop in traffic, you likely need to redo your metadata to upstage your competition.

Hitting a home run with competitive intelligence

With this complete guide on competitive intelligence, you should be able to get the edge your need over competitors.

You’ll understand what competitors are after, their plans, and indirectly – what customers want.

The journey doesn’t end here, though. Once you have customers’ attention, you need to provide them with a show they won’t forget. Check out our ecommerce customer experience guide to get up to speed on the topic.

Product Performance Analysis: Putting Your Data Into Action

The world changes over time. That’s a fact whether we like it or not. When looking into your numbers, you might notice factors that seem to change for no real reason but time. Understanding why these changes occur and why your products perform how they do is the heart of product performance analysis and the key to your business’ growth. 

What makes a great product? Is it audience reception? Hitting a certain number of units sold? Making a certain amount of profit?

The answer depends on the industry, business, and specific strategic goals. A profitable product can be considered a failure, while a break-even one is a resounding success.

In order to determine your product’s performance and analyze it with your business plans in mind, you need a method that yields information on the individual product level. In other words, you need to employ product performance analysis.

What is product performance analysis?

Product performance analysis is all about measuring how well your product is doing with respect to the goals that you set out to achieve. It’s a process conducted by higher management, as they’re the ones with the information necessary to make such evaluations.

Unlike other analysis methods, product performance analysis is highly individualized, targeting a specific product at a time. It’s extremely rare for a business to launch multiple products with the same goals in mind, after all.

This means that every time you launch a new product, you’ll need to perform product performance analysis from scratch. But worry not! Once you’ve got the hang of it, the process of data gathering and analysis is actually quite simple, and similar methods can be used each time.

After all, it’s not how the data is being gathered that changes but what data you need.

The advantages of analyzing product performance

Before we get into the nitty gritty of how product performance analysis works, let’s talk about some benefits.

What we’ve laid out below will give you a general idea of what product performance analysis can do for you. Granted, this isn’t a complete list of the benefits it provides. That would stretch the word count into the high thousands as we’d need to get into really specific, niche situations. 

Let’s see what you have to gain.

Increased knowledge of customer-product interaction

Knowing how your customers interact with your products is vital when you’re in the product development stages of your project.

When designing a product, the first thing you should think about is what exactly that product will be used for. Then come the following questions:

  • What will it do? 
  • Who will use it? 
  • Why does it beat out the competition? 

Information from customer-product interactions will help you answer these questions in a data-driven way, by giving you insight into the minds of your customers. It’ll tell you what they want from your product, how you can improve it, and where you’re hitting the mark.

Performing customer-product interaction is especially important in software fields, where the ever-changing nature of the market means that you must keep a close eye on what your customers want from you.

Adobe has certainly taken this to heart, with their Acrobat 2020 version featuring several unique features that are clearly based on customer interaction data. 

For example, the software giant added a color customization capability in the Fill & Sign tool, allowing you to choose specific colors for your signature.

Adobe

On top of that, the 2020 version includes:

  • Improved accessibility features.
  • Support for the use of tablet pens when using the software.
  • Increased control of signature panels.
  • Touchbar support for MacBooks.

Many of these improvements are most likely born out of going over user data, telling Adobe that:

  • Users with accessibility needs were using their software.
  • Users were using tablet pens and other similar devices while using their software.
  • Users were signing documents with their software.
  • A high proportion of users were using MacBooks.

While the software industry benefits significantly from customer-product interaction, especially due to its measurable nature and ease of data gathering, it’s not the only one.

Other sectors can enjoy the fruits of such analysis by gathering user feedback via surveys or other organic manners like customer reviews. With the right analytic tools, you can discover a trove of data that will help you improve your products.

Reduced customer churn

It’s also been well-documented that acquiring new customers is significantly more costly than retaining your current ones. 

That’s why many businesses must invest in churn-reducing strategies. These include:

  • Lightning-fast customer support.
  • Behavior-based predictive analytics.
  • Personalized and focused promotions.

Another way is to give your customers what they want and need. By tapping into the information you’ve acquired from your product performance analysis, you may be able to adjust certain aspects of your product to keep your customers happy. 

Twitter, for instance, is rolling out an Edit function to select users, something that users of the platform have been asking for for years. 

Twitter

Improving your products is an excellent place to start, but it goes deeper than that. You need to make products that are not only useful but ones that understand your customers’ needs.

Recognizing user engagement drivers

It’s all well and good knowing what your customers like about your product, what they use, and what they don’t, but understanding the drivers of these is another matter entirely.

This is especially true for offline, physical products, where the link between what a product is nominally intended for and what it is actually used for can be radically different without any indication. 

I’m sure you’ve probably seen one of these, whether it’s what you made when you were in school or simply in passing.

Spider

It’s certainly recognizable as a spider decoration, but what isn’t always known is that the legs are made from pipe cleaners. These days, it’s very rare to come across one being used for cleaning pipes, actually.

Looking from the perspective of a product performance analysis, making arts and crafts with these would have been totally unexpected. Yet, it’s the main user engagement driver for pipe cleaners these days. It just goes to show, what you think a product will do isn’t always what it will end up doing.

A better understanding of your customer base

When attempting to create products, one of the first questions that are asked is often “who are we making this for.”

Tying in with user engagement, different demographics of consumers tend to have different habits, different ways of doing things, and different features that they want out of a product.

It’s true that everyone is an individual, and that no two people will want exactly the same thing. However, you can still make generalizations.

It’s not stereotyping to say that people over 70 will want large text options in media, after all that demographic tends to have worse eyesight than those younger than them. If you’re targeting over 70s, you should therefore include these options.

However, it isn’t always clear who is using your products. Looking at the case of the pipe cleaner spiders, the customer base for pipe cleaners is radically different from what was expected at the time of launch. 

Manual laborers vs. schoolchildren is quite a big difference, after all.

Product performance analysis can give you information on your customer base, who they are, where they’re based, what they do, etc. Information is power after all, and you can make your products more specialized and therefore more relevant if you know exactly who is buying them.

Of course, it’s entirely possible to end up with several different demographics buying your products. In fact, that’s likely the norm in a lot of markets.

What happens then? You can continue adding features that appeal to all demographics to make a product that’s a good average, or you can specialize.

One company that’s been on the ball with specialization in recent years is Wizards of the Coast. Their Magic: the Gathering cards are purchased by two main types of consumers:

  • Those who want to play the game because they find it interesting.
  • Those who want to collect the cards because they find them aesthetically appealing.

Starting in 2019, Wizards began making special cards with alternate artworks, designed to appeal to the second cohort of customers. You can see below the differences between these cards and the regular releases, with one being practical and easy to read, and the other more focused on appearance.

Shark

Wizard

These alternate editions of cards proved a huge success. As a distinct entity, they didn’t appear in regular product editions and so appealed to the second cohort without any backlash from the first.

How do you perform Product Performance Analysis?

Below we’ve laid out a list of steps for you to follow in order to create your analyses. With these templates in hand, you’ll be able to make adjustments that would fit the specific needs of your businesses and be on your way to a successful analysis.

#1 Set your goals

In an ideal world, all you’ll have to do is push the “analyze my product’s performance” button. In reality, setting your goals means deciding how to analyze your product. In other words, the first step is to determine what you want to achieve with your product. 

What would you consider a success? A product that’s a failure in one regard might be successful elsewhere. Some products are launched solely to make money, others have different aims. 

This question will dictate the metrics you’ll be using. Is it units sold? A certain profit margin? Beating out a competitor?

Then, you’d need to set up the timespan you’ll be looking at. Remember, some products take time to reach their full potential.

Let’s take a look at some examples to get a better feel of how it works. 

Promotional items

I’m sure you’ve seen those small gift bags given away at events and conventions. You might’ve handed some yourself.

As you may know, the purpose of these items isn’t to make a profit (not directly anyway), but to give event attendees a physical reminder of your presence there and warm them up towards your brand. 

To measure success, you may use “items given” as a metric. Perhaps a better one would be expecting an increase in traffic on your website in the days following the event. 

Raising awareness

Some products or campaigns can be created solely to bring attention to your brand. 

A good example of a campaign made to raise awareness is PlayStation’s Play and Plant initiative. For every player that reaches a certain section of the video game Horizon: Forbidden West, the corporation will plant a tree in their name.


Horizon

Players won’t buy the game to plant trees, but this initiative generates positive headlines for PlayStation and raises awareness of both the game and the brand.

Measuring the success of similar awareness efforts isn’t easy. 

Awareness is the first stage in the marketing funnel, and it may take a while for potential leads to convert into paying clients. Your best bet to assess this is by monitoring traffic, leads, and conversions over time, trying to find an uplift in these metrics.

Boost sales of another product

Whenever you look to purchase a new phone charging cable, it’s super cheap. In fact, you’ll probably wonder how on earth any profit is made from them. 

That’s because they’re not in fact designed to make a profit, but to support the use of the mobile phones that particular business sells too. 

With different types of phones come different connectors. If you purchase an iPhone right now, for example, you’ll need a different charging cable than you would if you purchased an Android. 

Put yourself in a buyer’s shoes for a second. 

If a particular brand of phone needs a charging cable that is expensive or difficult to find, you’re likely to look elsewhere for a complete set. 

You might even decide to buy a different model of phone when your charging cable breaks, rather than simply replace the cable if it’s costly or tedious to do. 

Thus, phone charging cables can be seen not as profit makers, but as support to the phones that a maker sells. Their success would be measured not in profits, but in customer retention rates. 

Ultimately, it’s up to you to decide, and with any luck, you’ll be able to pick sensible options that align with your business goals.

#2 Define the relevant data

Once you know what you’re looking for, the next step is determining which data is relevant. 

If you’re looking at product features, you’ll look to detect statistics and other product data sources.

If profit margins are your game, look to financial figures.

This step follows from the first, but the metrics that you use aren’t always obvious. If in doubt, think back to your overall business goals as an organization. Aligning these with your data collection will greatly assist in choosing metrics.

#3 Pick your methods of data collection

Once you’ve decided what metrics you want to track, the next step is to decide what methods you’re going to use to collect the data. 

Once again, this step is heavily dependent on the previous. The data you want to collect will determine the method of collection, with only a few different options available.

Are you looking for quick, easy-to-collate product ratings? Look to STAR reviews and similar.

Do you want detailed information on your product’s capabilities and how they meet your customers’ needs? You’ll need to search for more detailed review data.

Data collection can be done both in retrospect and in real time. Real-time data is usually considered more up-to-date as customer opinions can shift over time, but it is also far more difficult to collect.

Some ways of obtaining real-time data include sending out regular surveys, conducting incentivized review programs, and using software to obtain new information from the internet.

#4 Collect & analyze customer data

Once the first three steps have been decided, it’s time to put your data collection plan into action. 

The time scale of your plan will vary depending on your particular plan, but in general data collection should go fairly quickly.

When the data is collected, you should make sure to format it correctly. It’s no good having all the data in the world if your analysis software can’t read it. 

Collect data

This is especially true when pulling data from multiple sources that might have different internal means of formatting. 

What analysis tools you use, and what software you use, will again be determined by your needs. In the next section we’ve laid out a few different ways of performing analysis that can be useful in different contexts, and with any luck, you’ll be able to determine which one is right for you.

#5 Put the information you’ve obtained into action.

Finally, you need to act on the information you’ve found. There’s no use in doing all this analysis if you’re not going to do anything about the situation, after all.

When acting on your information, it’s important to keep in mind that this is all retrospective. Information quickly goes out of date, especially in the case of volatile markets such as fashion or software.

Ultimately, what you do will be heavily dependent on your situation, the information you’ve found, and the market you’re in. There isn’t really a right or wrong way of acting, however, we can give general advice on scenarios that might pop up.

  • Are you seeing that customers aren’t happy with a change? Rolling it back will be the way to go.
  • Are your products seen as outdated? You’ll need to look at your designs again.
  • Do you see a drop in sales? There will be a reason for that, you need to look further.
  • Are your competitors’ products seen as more desirable? Take a look at them and see what they’re offering that you’re not.

Analyzing your data

Product performance analysis has several functions, with the one you pick being the one most relevant to your goals. Below you’ll find some of the more common ones, how they function, and why they’re important.

Bear in mind that many analysts use multiple categories in order to get a more rounded view. However, the more types of analysis you use the more likely it is that you could get mixed signals from your data, so be careful!

Funnel analysis

Funnel analysis is all about diagnosing your sales funnel, a term used for customer journey analysis that starts with marketing, goes through to sales, then ends with purchasing. 

It’s about the actions the customer takes, rather than the actions of your business.

Funnel

Sales funnel analysis will look at the process’s separate parts, from the first interactions your customers have with you, to the end of the line when the purchase is made.

Trend analysis

Trend analysis in this case means tracking customer behavior. Opinions and beliefs change over time, and the behavior that these create will change accordingly.

Trend analysis uses both current and historic data to determine where the market is headed. It’s not always obvious when a change is beginning, so you need to be careful. What looks like a small rise in a figure could actually be the beginning of a drop, or vice-versa.

Trends

In short, only trust your data if it’s showing these trends over a long period of time.

It’s extremely useful to split customers into their demographics when performing trend analysis, as different demographics tend to have different behaviors overall. This is especially great for age groups since younger consumers tend to prefer a more tech-heavy experience than older ones.

Cohort analysis

This one is trickier to define. A cohort is similar in some ways to a demographic, that being that they are all customers who experience common things. That being said, it’s not quite the same as the event can also be factors like the month or time of day when the purchase occurred.

Cohort analysis is extremely useful as it tells you facts about your products over time. 

Are you seeing an increased number of complaints about product defects in one month, but not the one before it? It’s likely that your manufacturing tools have developed a fault.

Did reviews drop after a competitor launched their product? Customers are probably comparing your product to your competitors and finding that they fall short.

What’s difficult with this type of analysis is determining which cohort a customer will fall into. This is much easier in ecommerce, where everything takes place online, but can be done with proper data tracking for offline purchases too.

Customer journey analysis

While this might at first glance seem to be the same as sales funnel analysis, you need to remember that a customer’s journey doesn’t always stop at the point of purchase.

Customers are a valuable advertising tool, with it being well known that a friend referring a product makes it far more likely that someone will purchase from you than if they have no information.

Customer journey analysis tracks a customer’s behavior in the following stages:

  • Awareness.
  • Acquisition.
  • Adoption.
  • Assimilation.
  • Advocacy.

In each stage, the customer becomes more and more likely to do some of your marketing for you. Analyzing these steps will allow you to see what makes a loyal customer, and how you might improve the process.

You can read more about customer journey analysis here.

A/B tests

A/B tests are a means of checking if you’ve made the right decisions. They involve two metrics, one that you have control over, and one that you measure the outcome of.

Take, for instance, the color of the packaging you use for your product. This can be your controlled metric.

A/B testing

By changing the packaging from purple to orange, you can then measure the overall impact that this has on the other variable. This way you can optimize the things you can control about your product.

A/B tests are often used in the product testing stage with test audiences, as this is much less costly than rolling out the changes across an existing product. 

That being said, test audiences do miss things. Limited-time releases can serve the same purpose as tests, with the changes potentially being made permanent or into an offshoot if they prove popular.

Coca Cola

Coca-Cola Raspberry, for example, was first sold on a trial basis in New Zealand back in 2005. It was discontinued as planned at the end of the year, but has since been brought back and expanded to four continents.

What metrics you should use for product performance analysis?

When the word metrics is used, what it means is anything, absolutely anything, that can be measured and recorded about a product over time. This can be something as inconsequential as the volume levels of production machines, or as important as sales figures.

When we’re talking useful metrics, it refers to anything that can be used as a measure of a product’s success. 

We’ve laid out a few of the more important ones below, but be aware that it isn’t a be-all, end-all list. Any factor you think is important can be taken into account – it’s up to you to determine what is, and isn’t relevant.

Business-oriented metrics

These metrics mostly look at things from the perspective of your business and it’s relevant processes.

Revenue per product

Let’s start with the big one. Revenue.

The amount of profit you’re making is extremely important, as the end goal of most businesses is to make money and stay afloat.

The amount of revenue you make per product sold determines your profit margin. It will also tell you if it’s worth expanding into new territories where shipping costs will be higher, and whether or not the product would be worth keeping at all.

It all depends on the strategy you’re using. Some products rely on a high volume of sales with a low-profit margin, others the inverse. Keep your strategy in mind when analyzing this metric.

Cost to acquire new customers

It’s often said that it’s easier to keep existing customers than it is to attract new ones. While true, more customers is always better.

The cost of acquiring a new customer will give you information on how you should proceed with your marketing plans. Is your product one that will easily attract new faces? If so, you should keep it at the front and center of future marketing efforts.

On the other hand, if your product isn’t very attractive to new customers and will likely cost a lot to obtain, you’re better off focusing on keeping your existing customer base.

Customer lifetime value (CLV)

Customer lifetime value refers to the amount that a single customer is worth to your business over the entire span of your relationship with them. This can be anywhere from a single purchase to a loyal, lifetime subscriber.

CLV is a useful metric as it will tell you about customer behavior. It ties in with the customer retention rate metric that we’ll talk about further down, but is a more numerical indication with other functions.

How far should you go when attempting to retain customers? At what point should you be fine seeing them go? CLV helps you determine at what point it’s still profitable to try and keep a customer. 

Customer-oriented metrics

These metrics are all about your customer base, and how they interact with your product.

Revenue per customer

How much is a particular customer spending with you? Can you expect and rely on a high volume of purchases from a small group of people, or should you aim to market to a wider audience?

Revenue per customer ties into the customer’s lifetime value, but is aimed at short-term analysis in the immediate future, rather than the long term.

Customer sentiment toward products

How do customers feel about your products? Remember, emotion is a huge driver in choice when purchasing a product. Customers are willing to pay up to 140% more with a brand they’ve had positive experiences with in the past.

It’s the main reason we’ve created Sentimate, the world’s first AI-powered product insight engine.

With Sentimate you will have access to the combined might of all publicly available reviews on a product, using sentiment analysis to detect customer sentiment in highly contextualized situations. 

Customer retention rate

The proportion of customers who can be considered loyal is another great source of information.

How many of your customers stay with you after purchase? Can you expect repeat purchases, or should you aim your marketing more toward one-time customers?

Your customer retention rate will be highly contextual, depending on factors such as industry, sales model, and target demographics. By factoring that in, you can learn a lot more about your products.

For instance, USA Pan offers a lifetime guarantee on some of its products. That’s a literal lifetime, meaning that at any point between purchasing from them and your death, they’ll replace your products for you if they break.

Pie pan

Obviously, a low customer retention rate for these products isn’t a problem. In fact, even if it were zero then they wouldn’t see a problem with it.

If you sell a product with a limited lifespan, on the other hand, you’d be concerned if your retention rate was low. Context is key to this metric!

eCommerce-only metrics

We’ve split this section off from the main body since it’s so specific to analyzing the way ecommerce functions. 

eCommerce has a huge advantage in product performance analysis, since by it’s nature, information is communicated back to the hosts. I’m sure you’ve seen a little pop-up when an app crashes, asking to send a report.

Crash

The advantage is even greater in the case of self-hosted websites, in which the software that runs it is hosted on your own internal servers and therefore can be analyzed in the most minute of details. You don’t need permission to analyze your own files or to gather data on how your own servers are running, after all.

These e-commerce-specific metrics are heavily indicative of how well your assets will function, and of how they’re being received by users. While analyzing them might not be that straightforward, a means of gathering these metrics should be built into them in order to make data collection simpler.

Task times

How long does it take your customers to perform certain tasks? Is it around what you’d expect or does it take longer?

See, the thing about navigating websites or apps is that once you know what to do you’re completely fine. Developers will naturally know what software does and how to perform tasks, as they know it inside and out.

Your users, on the other hand, aren’t so lucky. If a task takes them significantly longer to perform than you think it should, they’re probably having problems. 

Whether that’s with finding the correct links, the interface layout, etc., is up to you to find out, but a task time will tell you that there is a problem in the first place.

Task exits

On the flip side, there are task exits. Is there a particular task or feature that a high proportion of users exit from? If so, you’ve probably identified a pain point that needs to be fixed.

Any place where many users stop using your website or app is an absolutely huge problem. It’s something that’s big enough to stop them from interacting with you altogether because of how much it frustrates them, which is the exact opposite of a good customer experience.

Errors logged

Errors are pretty self-explanatory, and they’re expected in self-hosted websites and apps more than template ones. It’s also a fact that nobody can release a piece of software without them, so you need to keep an eye on where they are logged if you’re using someone else’s software as a template.

The places where the most errors are logged can indicate where users are having trouble with your media, but it can also indicate the number of users using that feature. This will help greatly when prioritizing which to begin patching. 

A major bug that only affects a few users might be considered less important than a minor one that affects everyone. It’s up to you to decide, but error logging information can help you there.

Users unsubscribed

I’m sure you’ve all seen the little boxes that pop up when you unsubscribe from a service or mailing list. The ones that ask you “why did you unsubscribe” and potentially “here’s an incentive to not do that.”

Unsubscribe

The amount of users unsubscribing from your mailing lists or from notifications are useful, as it can indicate when problems began occurring and assist you with tracking them down. However, if you’re given the reason that users unsubscribe it will assist you far, far more.

(De)activation of features

Ah, features. The shining light and also the bane of software’s existence.

When dealing with modular apps, users can activate and deactivate certain features as they please. With this information, you can determine what features users like and dislike, as well as how certain cohorts use your app.

Naturally, this will give you insight into what future features you might want to add, what current features you should accelerate the development of, and what you might want to drop.

Session durations

Session durations are another fine source of information. The amount of time customers spend on your website or app can give you insight into how your customers interact with it.

Are they mostly spending five minutes here and there? It’s likely that you’re being used to find specific items that they trust you for.

Are sessions longer? It’s likely that users are either exploring your features or simply that they use you regularly as a reliable seller. You can cross-reference with your sales statistics to check this. 

Unique user rates

The number of users that are connected to you at any one time is useful information. The amount of unique users is much more interesting.

Your software will log every individual account’s interactions with it, thus allowing you to track the number of unique users at any point in time. This will let you see interesting pieces of information such as:

  • The average lifetime a customer will interact with you.
  • Whether or not new users are joining at the same rates.

This tells you how users are interacting with you.

Are they connected with you for short periods of time and be done with it? It’s likely that you’re being used to find the odd item that they can’t find elsewhere.

Are you seeing consistent use by the same users over time? You’re likely a lynchpin of their daily routines.

What happens if my data conflicts?

You’re never going to get the complete picture from a single piece of data. That’s generally why we try to analyze several in order to get a more rounded view of things.

Unfortunately, when you have multiple pieces of data that you’re tracking, some of them will inevitably conflict. If that happens, don’t panic! There is usually a solution, though it might not be immediately obvious.

Check your methodology

The first thing you should do when you’re seeing conflicting data is re-check your methods. If there’s a flaw in one of them, that might explain why you’re getting mixed signals.

If you find no flaws, you must conclude that the data is sound. But how can that be? How can two completely opposite things be true at the same time?

Well, you’ve got to consider that no two pieces of data are collected the same way. There’s always going to be a bias depending on the method. There might be a factor at play here that accounts for the discrepancies.

Online surveys are more likely to be completed by younger customers, for instance. If one piece of information was gathered online, and the other offline, they may be coming from different cohorts. 

Examine your cohorts

The solution there is simply to split your data to account for the differences between them.

Next, if you find no distinct difference between the cohorts that gave you the data, look to when or where in the customer journey the data was collected. Let’s take a look at customer sentiment, which tells you how customers feel about your product.

Are you dealing with after-purchase? At the point of purchase? 

Customers are much less likely to post a review as time goes on after the purchase. Thus, any review that’s posted a long time after purchase is likely to be heavily weighted. It’s also an unfortunate fact that the longer the wait the more likely that review is to be negative.

Thus, data that says customers are both pleased with your product and have a burning hatred of it, can both be correct. 

Consider randomness

If this step reveals no differences, the only thing to do is simply chalk it up to the uniqueness of the data. 

Each piece of data you’ll ever collect is unique. While there may be overall trends it’s entirely possible to end up with completely contradicting pieces of information by sheer chance.

The key here is to remember that no analysis will ever account for everything that a customer thinks. There’s always the chance that you had a boom in the popularity of a certain feature one month, then had it drop away the next, for example.

In the case of directly conflicting data, remember that it will have been pulled from different individual customers, with thoughts and feelings of their own. Customers aren’t cogs in a machine, their thoughts aren’t predictable and sometimes you just have to shrug your shoulders and re-do your analysis.

Wrapping up

Conducting product performance analysis is key to understand what your customers are after, allowing you to cater to their needs.

It’s not a one-and-done thing, though. 

You’ll need to constantly assess the viability of your products in the ever-changing marketplace. The good news is that it gets much easier once you’ve got the hang of it and have the tools for the job.

Remember that product performance analysis is usually done after the product has launched. To better prepare yourself for these stressful and joyous occasions, it’s best to have a solid go-to-market strategy. Check out our complete guide for more. 


Building a Successful Go-to-Market Strategy: A Comprehensive Guide

When launching a new product or entering a new market, you would want to get the best possible results in terms of sales, brand awareness, ROI, or other KPIs. 

However, you will likely lose more than you gain without a documented marketing plan. That’s why businesses rely on a go-to-market (also known as GTM) strategy to increase their odds of achieving their goals.

Creating this plan is relevant for all businesses – from SMBs and startups to the enterprise level. Moreover, refreshing the one you used for a previous launch is always a good idea as circumstances, and people change.

In this complete go-to-market guide, you’ll find everything you need to get you running, including:

  • What is a go-to-market strategy is.
  • Why it is important. 
  • The key components of an efficient go-to-market strategy.
  • How to craft a successful one on your own. And,
  • Examples from leading brands.

Let’s get started. 

What is a go-to-market strategy?

A go-to-market strategy is a comprehensive plan that outlines how a new product would reach its end customers. 

Generally, every go-to-market strategy outlines the value proposition, target audience, entire marketing plan, and sales strategy. 

Sounds like your regular run-of-the-mill marketing plan, no? Well, there are a few key differences.

Go-to-market strategies vs. marketing strategies

If you’re in the early stages of launching your brand, your go-to-marketing, and marketing strategies might be fairly similar, but once you’re well established, they will diverge and become very different.

You can sum the differences up as follows:

Go-To-Market Strategy Marketing Strategy
short-term long-term
driven by a specific product business-wide
designed for product launch covers all time periods


Why are go-to-market strategies important?

Strategy is key to success in today’s markets. Creating a quality, data-driven, clear marketing strategy helps businesses to understand their aims and goals. 

First, it clarifies the reasoning behind the launch of a product or service, identifies the target market, sets a pricing strategy, and outlines the ways to draw and engage customers to a brand.

Secondly, a go-to-market strategy provides some quality control.

The design of a go-to-market strategy forces a business to evaluate and consider all the issues customers might have with their product or service. 

Identifying and mapping potential pitfalls helps brands to improve their customer experience – from product development to informing sales and support teams – creating positive sentiment and maintaining customer loyalty. 

Let’s talk about what makes for a good go-to-market strategy and what difference it can make for your success. 

What are the components of a go-to-market strategy?

go-to-market strategies have several layers, which we’ll discuss in more depth later. In general, a solid document will contain your:

  • Objectives: What you plan to do and how to achieve your goals.
  • Customer attraction strategy: How you plan to attract customers and convince them that you’re the best option for them.
  • Sales strategy: Your sales model and how you intend to promote your product.
  • Delivery strategy: How you plan to get your products to customers, whether via direct shipping, through a middleman, etc.
  • Customer support strategy: How you plan to handle potential issues and support your customers when they have difficulties using your products.

While every product launch should focus on the “objective” part, the other aspect will be prioritized differently, based on conditions such as the market and the product itself.

For instance, launching an iterative piece of software will require you to focus efforts on customer support, and a new yogurt flavor may need a clearer sales strategy.

To understand how to slice your pie the best way, you’ll need to perform quality market research and dive into the data.

Here are some points to consider.

4 key points about data-driven go-to-market strategies

Like many other marketing solutions, when done right, the go-to-market strategy is very useful and improves a brand’s sales and earnings. 

There are a few components for an efficient and effective go-to-market strategy. One main thing to consider when creating a marketing strategy is its market definition. 

A good go-to-market strategy has to define the consumer market for a product or service, helping optimize short- and long-term marketing efforts.  

Another important aspect is the focus. The marketing strategy needs to focus on the product or service and its benefits to customers in the current market. It should highlight what a brand can offer customers that competitors can’t. 

Additionally, an efficient go-to-market strategy should be flexible. In an ever-changing market, innovation is key. A successful go-to-market strategy is pliable and can be modified to match brand innovation. 

Solving customer pain points

A pain point is a problem current or potential customers are experiencing with a product.

Pain points can be present in many different parts of the customer experience:

  • Financial: Customers spend a lot on the current product or service and want to reduce costs.
  • Productivity: Customers waste too much time using the current product or service and want a more efficient solution.
  • Support: Customers aren’t getting the support they need along the customer journey stages.

Moreover, many customer pain points combine issues from several categories. 

To successfully deal with customers’ pain points and present your brand as a viable solution, you first need to identify the problems

A quality go-to-market strategy relies on data collected to do just that. 

Improving product marketing

Product marketing is the term for promoting and selling a product or service. 

It entails deciding on product positioning and messaging, launching the product, and more. Successful data-driven product marketing relies on quality information.

And to get that information, you’ll need to perform market research.

This will provide you with information about potential customer markets, along with the needs and pains that affect them.

One way of performing market research is by listening to your customers.

Social media has become a platform for customer reviews, customer service, and product promotion. 

Through this, social listening is a great way to assess what messaging will work best and learn what social sentiment a brand is creating.

The go-to-market strategy provides a sturdy base for more focused market research and voice of customer analysis

Using a well-constructed strategy ensures the messaging is consistent and in tune with buyer personas and attitudes, helping sales teams to optimize marketing and get better sales and revenue.

Innovating your brand and product

As we said earlier, innovation is key in today’s highly competitive market. Businesses innovate using two main ways: 

  • The first is product innovation, meaning a new solution to a problem many consumers encounter. A brand can offer a product that addresses a formerly untouched issue or one that addresses the problem in a different way. 
  • The second is brand innovation, which is when a brand does something new. This can be launching a new product or making changes to an existing one. 

Creating a go-to-market strategy is a great foundation for a successful innovation of any kind, especially when it’s data-driven.

Having a strategy helps focus innovation efforts around set goals. 

Moreover, It maintains priorities and sharpens innovative ideas. This creates an improved innovation process that is more likely to aid brand growth and survival.

Crossing into new territories

Cross-border ecommerece shopping is taking the world by storm. It’s set to exceed $1.9 trillion In 2022, growing even further in 2023. 

As consumers shift more and more to online shopping, businesses must prepare themselves and expand their ecommerce abilities to new territories.

But before opening up your wares to international shoppers, it’s imperative to prepare a strategy to penetrate these new markets. 

A few essential steps to make before the expansion include product research, cross-border taxes, logistic costs, language barriers, and more.

Gathering data for a data-driven go-to-market strategy

Now that we reviewed the aspects and advantages of the go-to-market strategy, let’s talk about how you can get the data needed to create a data-driven one. 

Performing customer-centric market research provides insight into customer desires, needs, and attitudes.

Revuze offers AI-powered Customer Experience (CX) analysis to help you better design marketing strategies. 

Revuze developed the first self-training, low-touch AI technology that collects and analyzes data automatically and delivers consumer insights valuable for data-driven go-to-market strategy design.

How to build an excellent go-to-market strategy?

By now, you might be thinking, how exactly do I build a go-to-market strategy? I’ve read all of this information on what they’re about and what they do, but I have no clue how to build one. 

Fear not. We’ve outlined nine simple steps to take you from novice to expert.

#1 Find your product-market-fit

Every product launch should be designed to solve a problem.

A great product looks at what consumers want, addressing their pain points and drawing customers to it. 

There’s no use in providing a product that a competitor makes cheaper, sturdier, and easier to use.

It’s a concept known as product-market-fit, the ability of a product to satisfy a demand that the market creates. 

If you manage to nail down your product-market-fit, you’re off to a great start.

#2 Define your target audience

Every product launch has a target audience. Those people who ideally will be the ones to buy your product. If you want to define them, you need to look at the following factors:

  • What problems does your product solve?
  • Who has these problems?
  • How much are they willing to pay to solve said problem?

If your product only solves a minor problem, your price must reflect that. Customers aren’t usually willing to spend a lot to satisfy a minor issue.

#3 Research your competition and the current market state

Unless you’ve spotted a gap in the market that no one else provides, you can expect to see competitors already existing within your market space. 

In order to get a leg up on them, you need to know them. Asking the following questions will help see the full picture:

  • Who already provides a similar product?
  • What demographics and geographic areas do your competitors consider their target audience?
  • Are your competitors meeting the demand that customers create? Is the market oversaturated, undergoing scarcity, or somewhere in between?
  • What do you provide that your competitors do not? Conversely, do your competitors’ products have any features that yours lack?

Competitive analysis, as it’s known, is key to understanding your position within the market, your strengths & weaknesses, and any opportunities & threats that might come your way.

#4 Decide on your key messages

Once you know who you’re targeting, you need to decide what messages you’ll convey to them.

Each demographic you target will require a personalized approach since they will react differently to the same message.

You should create what’s known as a value matrix. This is a summary of:

  • Their pain points.
  • How your product might solve said pain points.
  • How do you plan to convey that to your customers?

Buyer personas will assist you greatly here, as well as simulations of customers with their problems, values, and goals. 

You can use these to get an idea of what a particular demographic might want and how they might respond to you.

#5 Map out your customer journey

The customer journey is the sum total of interactions that a customer has with you, from first hearing about you and your products, all the way to the point of purchase. 

The way to map out your customer journey is to identify:

  • What touchpoints exist between you and your customers?
  • How do you want to influence your customers at those touchpoints?

And from there,

  • What type of interaction is needed to facilitate your ideal influence?

The best way to visualize your touchpoints is in the buyer’s funnel. This splits the customer journey into three sections:

  • Top: Customers have a problem but are not yet in contact with you.
  • Middle: Customers know you exist but aren’t sure if you are the best option out of the range of potential products.
  • Bottom: Customers decide whether or not to purchase your products.

The touchpoints within each funnel section will roughly aim to grab the customers’ attention in the top phase, convince them what you offer is best for them in the middle phase, and convince them to commit to buying from you in the bottom phase. 

With the combination of your aims at each step and your target demographics, you can work out exactly what you need to communicate to your customers and how you should do it.

#6 Choose your marketing channels

Marketing channels vary wildly, from TV commercials to internet adverts, newspaper prints to marketing emails. 

Each demographic will have its preferred way of communicating, and it’s up to you to align with your customers’ preferences if you want to stay relevant.

Generally, you should choose your marketing channels based on how your demographics consume content. If you have multiple target demographics, choose multiple channels accordingly.

Further, we recommend using different marketing channels for each customer journey stage. 

For instance, a YouTube ad might make customers aware of you and push them down the top of the funnel, whereas an email or presentation will help them pick you out from among dozens of other products within the middle.

#7 Choose your sales plan

Ultimately, a go-to-market strategy aims to generate sales and revenue. Thus, you need a sales plan. 

There is a myriad of different sales strategies you can use, but some of the most common ones are:

    • Self-service: Customers find you and purchase from you on their initiative.
    • Inside sales: Your sales team forms a relationship with your customers and convinces them to buy from you.
  • Field sales: Your sales team focuses on closing big deals, focusing on enterprises.
  • Channel sales: You pass your product on to an external partner, who sells your product for you.
  • Inbound sales: Sales processes are adjusted based on buyer actions.
  • Outbound sales: Sales processes are adjusted based on seller actions.
  • Cross-selling: You focus on selling your product in conjunction with others.
  • Up-selling: Your sales team takes existing customers and encourages them to upgrade.

Each of these models has its strengths and weaknesses, and the decision to use is ultimately up to you. You should pick one that aligns well with your product and business model.

#8 Decide on your goals

Goals are factors such as sales figures in a specific amount of time, sales figure growth, amount of consumers contacted, etc.

They tell you whether or not your strategy is working and whether carrying on the way you currently are is the best way to continue.

Goals often fall under frameworks such as:

  • Key Performance Indicators (KPIs).
  • Objectives & Key Results (OKRs).
  • Specific Measurable Achievable Realistic Time-Bound Goals (SMART Goals).

You can use one of the above to set your goals, a combination of two, or even all three!

#9 Lay out the steps that will help you achieve your goals

Now that you know what you want and how you can achieve it, it’s time to set out the steps to help you get there.

Creating a clear and well-crafted go-to-market strategy means working backward, seeing the obstacles that might appear in your path, and how to avoid them. 

For instance, you might have a goal of selling 10,000 units of your product within a month.

However, an obstacle you foresee is that your sales teams might use different strategies, only some of which are effective.

The solution to this problem is to find the optimum sales strategy and communicate this to all teams. 

Of course, these steps aren’t the be-all, end-all. 

Once you have a go-to-market plan, you may need to adjust it based on new information. 

This doesn’t mean that you’ve failed to create an effective strategy. 

A go-to-market strategy, by its nature, treads into untested waters, so there are bound to be a few hiccups.

Keep your steps clear and flexible in case you need to re-evaluate your strategy. Share any updates you make with your teams, stakeholders, and management so that they know what’s going on and, most importantly, why it’s happening.

You should be all set by now, ready to draft a winning go-to-market strategy. But before you go and do that, let’s check out some winning examples from leading brands.

Winning go-to-market strategy examples

unnamed

Smart Coach by Fitbit

unnamed

Fitbit manufactures activity trackers. A few years ago, they launched a premium service and personal training app, which can be integrated with the user’s Fitbit. 

Fitbit’s go-to-market strategy for the Smart Coach involved:

  • Using paid and owned channels to reach the target audience. 
  • Understanding their target audience consisted of people who own Fitbit devices. 
  • Leveraging push notifications, social accounts, and emails to reach potential customers. 

As a result, Fitbit earned around $192 million in revenue through its GTM strategy. 

Key Takeaway: If you are releasing a new feature, inform your existing customers first. 

Eight Sleep’s partnership with IFTTT

A smart mattress manufacturer, Eight Sleep, created a go-to-market strategy for a new feature of their existing product. 

Eight Sleep partnered with IFTTT, a free service that lets you create conditional statements and integrate various apps. Together, they developed a new feature that allows its customers to simplify their night and morning routines. 

Users can connect their mattress with their smart home system to:

  • Turn lights on or off.
  • Start their coffee machines.
  • Lock the door.
  • Activate bed warming. 

Customers could perform all these activities from their smartphones and virtual assistant devices.

Eight Sleep’s go-to-market strategy for the new feature involved:

  • Sending emails to the entire user base to help them realize the possibilities. 
  • Creating a dedicated landing page to inform and educate users about the new feature.
  • Highlighting the benefits and use cases of their feature on Facebook and Instagram. 
  • Getting themselves included in the IFTTT guide and newsletter. 

Key Takeaway: Apart from informing your existing customers, leverage social media marketing and get featured in major publications to broaden your reach. 

Upscope leveraging live chat to target a new segment of customers

Upscope is a screen-sharing software. When it was founded, many screen-sharing software packages were already available in the market. 

unnamed

To make themselves stand out, they created a GTM strategy that consisted of: 

  • Creating ways to use live chat to target a new segment of customers (technical support, onboarding specialists, and customer success teams). 
  • Leveraging content marketing to drive traffic to their website.
  • To get listed on their websites, partner with existing live chat companies such as LiveChat, Zendesk, Drift, and Intercom. 

As a result, Upscope has acquired over 600 customers and is increasing. 

Key Takeaway: Partner with other businesses with a complementary audience to yours. Use their existing reach to boost your brand awareness. 

The new storytelling feature launched by VSCO during COVID-19

VSCO allows users to capture and edit visuals (photos and videos) and launched a new tool called “Montage.” 

It is a multimedia creation tool that brings visual storytelling to life in a new dynamic way through a video. 

unnamed

Their go-to-market strategy involved addressing the current environment and our challenges as humans. 

Their product announcement message was also crafted keeping in mind how their product helps us connect in the age of social distancing. 

Their email copy reads, “as the world slows down, we know that these times can be difficult and uncertain. And in a small way, we hope our community connects you with others around the world.”

This is great because they first addressed the current situation and then how their product helps us solve this problem. 

Key Takeaway: In times of crisis, aim to help your community. Explain how your product can help your customer in difficult times. 

Nisolo launches new slippers to make Work From Home more comfortable

When most people around the world stay at home due to the fear of COVID-19, Nisolo launched a new slipper to make work from home more comfortable. 

Nisolo ensured their marketing message doesn’t look promotional and showed how they care about their customers. 

unnamed

Nisolo’s email copy first focuses on the email subscribers’ emotional well-being and then announces its new slippers. 

Key Takeaway: Create unique products that focus on helping your target audience rather than selling to them. 

Huawei’s entry into the Indian market

Huawei is one of the most prominent telecom suppliers in the world. However, the telecom equipment market was overcrowded when Huawei was planning to enter the Indian market. Their biggest challenge was to make an impact to outdo their competitors (Apple and Samsung). 

To increase its chances of succeeding in India, Huawei developed a go-to-market strategy that involved building local R&D centers to hire locals and show commitment to creating value for the country. 

Further, Huawei partnered with a leading Indian English-language news channel to sponsor a contest. In the competition, Huawei smartphones were projected as aspirational products, contrary to the popular belief that Chinese products are low quality.

As of now, India is Huawei’s second-largest research base outside China. In the first three quarters of 2017, Huawei grew 60% in India’s enterprise business, higher than the global average (43%). Huawei India’s global production increased steadily until 2021 when the 2019 US sanctions against China caused the business to drop production.

Key Takeaway: When entering new markets, identify your biggest challenge and create strategies to solve them first. 

TaxJar’s content marketing strategy to build trust

TaxJar offers tax solutions to businesses. When launching, the company looked at itself as a technology company first and a tax company second. Their primary aim was to make a better product than what was available in the market. 

They also noticed that most of the content on the internet related to tax was either hard to find or difficult to understand. 

TaxJar started publishing the best possible educational content to help its target audience understand everything about sales tax. 

As a result, TaxJar built trust with its target audience and started getting customers. 

When it comes to sales tax, more than 20,000 businesses and developers trust TaxJar.

Key Takeaway: Conduct market research to identify gaps in the current market and fill them to build trust with your audience. 

Symyx’s plan to penetrate new market segments

In 2008, Symyx created a GTM strategy to ensure the successful launch of its ELN (Electronic Laboratory Notebook). 

Symyx’s go-to-market strategy included:

  • Print advertising to boost brand awareness and build confidence. 
  • Author or appear in 12 feature articles in target publications to emerge as a thought leader in the ELN market. 
  • Publish case studies to demonstrate the effectiveness of their product. 

In the same year, Symyx generated $9.6 million in revenue. 

Key Takeaway: Make the most of PR strategies and demonstrate what value your products can generate. 

Slack’s product-led go-to-market strategy

Slack is one of the leading business communication platforms in the market. 

Slack’s go-to-market strategy was to rely on product features and usage to increase customer acquisition, retention, and expansion.  

unnamed

They didn’t aim to sell software. Instead, it sought to sell a positive user experience. 

In the memo shared by Stewart Butterfield to his team before they released the product, he said, “People buy “software” to address a need they already know they have or perform some specific task they need to perform. 

However, if we are selling “a reduction in the cost of communication” or “zero effort knowledge management” or “making better decisions, faster” or “all your team communication, instantly searchable, available wherever you go” or “75% less email” or some other valuable result of adopting Slack, we will find many more buyers.”

Slack ensured that its product was better than any other business communication platform. They also ensured that their product was user-friendly and easy to use. Slack created a “customer development team” to better serve its customers. 

As a result, Slack became the fastest-growing SaaS company of all time. Slack grew from $0 billion to $4 billion in valuation in four years and currently earns over $250 million a quarter as of 2022.

Key Takeaway: Make your product better than your competitors. Create an excellent customer support team to help your customers make the most of your product. 

Go-to-market strategies in times of crisis

COVID-19 is somewhat behind us, but it taught us much as marketers.

Launching a product during a crisis is different than entering the market on regular days. You need to be very cautious with your sales strategies, marketing messages, and who to target.

Get yourself ready for the next turmoil by following these tips.

Optimize your messaging, targeting, and pricing

As a business owner or a marketer, it is your responsibility to ensure your messaging doesn’t hurt your target audience’s sentiments. 

For example, during the COVID-19 times, using words like “get in touch” or “meet our team” wasn’t a good idea. Instead, we used phrases, such as “call our sales team,” or “let’s get on a video call to discuss business opportunities.”

Make sure to optimize the people you are targeting. If you were targeting small businesses before COVID-19, check if they are operating now or are adversely affected by the crisis.

At the same time, the world economy is taking a hit. Many people and businesses are struggling financially. If you can afford it, reduce your product’s pricing for a limited time. 

For example, ABB has waived the fee for its numerous software services until the end of 2020 including ABB Ability Connected Services, RobotStudio, ABB Electrical Distribution Control System, and iUPSGuard software for hospitals. 

Focus on making things easier for your customers

In any type of crisis, people are going to be stressed. 

To help reduce the stress, look to eliminate any barriers to helpful information, offer additional access to support resources, and reach out to existing customers to understand their situation.

Campaign Monitor sent an email to all its subscribers that gave them an option to “pause the marketing emails for 30 days.” They also added a link to new content relevant to the times of COVID-19. 

This is great because not everyone wants to receive promotional emails at this time. When a brand takes the initiative to make its customers’ life easier, it will be remembered for longer. 

Help the community to earn a good name for your brand

Helping the community shows you are not just here to make money, and you care about the people around you. 

Therefore, it is crucial to help your community in any way possible. It doesn’t matter how big or small your contribution is. 

For example, to help first responders fight COVID-19, Under Armour delivered 20,000 face masks to Johns Hopkins Health System. 

Under Armour also donated $1 million to Feeding America to support hunger relief efforts due to current school closures and quarantines. 

Think beyond the immediate crisis 

While optimizing your go-to-market strategy in times of crisis, it is crucial to think beyond the immediate crisis, as each presents lingering effects.

Most people may be done with face masks, but social distancing is still prevalent.

Brands with offline stores must consider ways to sell products and accept payments while prioritizing social distancing.

Companies that relied upon on-field sales agents to sell their products will have to think of new ways to get their products across, such as self-service or inside sales business models. 

The best way to “think beyond the immediate crisis” is by building a team of creative people who can brainstorm and predict how the world might change. 

Note: It isn’t only about your company or your industry but about how the world might change after the crisis. Think about how you can use it to create new business opportunities. 

Wrap-up and takeaways

A go-to-market strategy helps you ensure your product launch succeeds and acquire customers in the tough competitive market. 

It’s important to remember it’s ever-changing. A GTM strategy that proved true and successful last time won’t necessarily yield the same results. 

You must keep up with the times and the people.

Data-driven market research will help keep an eye on what customers need and what pains them.

Only then you’ll be able to devise a successful and fresh strategy to launch your brand new product and service.

And what happens after? You’ll need to start getting feedback and analyzing it. But that’s a story for a different blog. Read it here.

How To Improve Your Star Rating On Amazon

Amazon Seller Reputation: Why It Matters

Increasing your seller reputation is never a bad thing. It lets you increase your sales, boosts your reach and lets you track how you’re doing in terms of marketing. Amazon’s star format is one of the simpler ones for customers and those who view you to understand, but it’s slightly more complex when it comes to figuring out how to increase it.

The first thing we’ll get out of the way is this – your seller rating is not the same as your seller feedback. One is determined by the other, but feedback is discarded by the algorithm and doesn’t have an impact after 365 days. Thus, it’s not only important to get lots of good reviews but get them often if you want to keep your star rate high.

The Difference Between Product Reviews And Seller Reviews

Product reviews aren’t the same as seller reviews. One is directly related to the product in question, while one to the seller. One is about the quality of the product, the other the service and experience that the customer had with you. You’ll find both options on your 

This might seem unnecessarily complex, but you need to remember that plenty of Amazon stores sell things that they don’t manufacture. It wouldn’t exactly be fair to put the burden of manufacturing errors on those who are just suppliers. It’s important to note that only those who’ve purchased from you can leave seller ratings, and only up to 90 days after purchase.

Seller reviews usually focus on packaging quality, shipping speed and communication by the seller. Anything that involves product description would also count. You might see feedback about incorrectly sized items, misleading photos etc. – these are also seller reviews.

Infographic

Your seller reputation, in other words your star rating, is concerned only with seller reviews. Given said rating helps determine where you rank in the Amazon search function, it’s important to keep it high.

The Definition – What Are Amazon Product Reviews?

Product reviews are the other end of the stick. They’re reviews that are specific to certain items or groups of items that you and others might sell. They’re written with the intention of helping future customers decide what to buy based on quality, durability etc.

You can leave a product review from the Orders tab just as you can leave a seller review, but it’s important to note that people who haven’t purchased from you can leave product reviews too – they just need to have purchased something from Amazon in the past twelve months. While this is designed to let people who obtained the product elsewhere leave feedback, there’s definitely potential for abuse so keep an eye out for ratings that seem suspicious.

Infographic

Given Amazon’s feedback system is in the form of comments left on items, you’ll often find product reviews and seller reviews lumped into one string of text. Customers don’t want to write things out twice when once is easier, so you’ll often find product reviews left in the seller review section and vice versa.

Why Are Amazon Product Reviews Important?

So, if product reviews don’t directly impact your seller rating why should you care about them?

Product reviews affect Amazon’s SEO, that is to say that if you have good ratings you’ll appear higher up in the recommended section of searches. They’ll also give you information about your products – quality, potential defects etc. This can be used by you directly if you manufacture your own products, or if you’re simply a supplier, used to decide what products you should continue to purchase from their manufacturers.

Product reviews also help in another fashion, and that’s to do with the psychology of purchasing things online. Consumers are suspicious of products with few reviews, thinking that they might be faked or inaccurate because of their small sample size. In fact, it’s been shown that how recent your reviews are also matters, with ratings from more than six months ago being virtually ignored by consumers browsing your products.

Techniques To Get Reviews On Amazon

So if reviews are that important, you’ve got to use techniques to get them. Most people won’t leave a review out of their own initiative unless they’ve had a particularly noteworthy experience, so a little bit of incentivisation doesn’t actually affect the accuracy of your reviews.

  1. Ask For Feedback

If you want feedback, you can just ask for it! Sending emails to customers asking for a quick review is a good way to get responses, as it’s quick and easy to do. 

Consumers are aware of the need for reviews to get good Amazon ratings, and a quick reminder is often enough to motivate them if they’ve had a particularly good experience with you, which will give you the bonus of good feedback.

  1. Include Links To Feedback Pages

If you’re emailing customers, you should include links to feedback pages for the specific items they purchased. Nobody likes having to put effort into something that they’re doing as a favor for someone else, so making the process as easy as possible is advised.

  1. Automate The Process

Of course, sending all these emails by hand is going to be a nightmare. The best way to get around that is to use automated email writing software, which has the added bonus of reducing mistakes made when transcribing links or product titles. The words Bread and Breed might look similar to a human, but to a computer it’s all 1s and 0s.

  1. Amazon’s Vine Program

It wouldn’t be capitalism without a pay to promote option. Amazon’s Vine Program is a paid program that lets you confirm that your reviews are genuine, and provides the option to get your products reviewed by e-commerce experts.

  1. Social Media Campaigns

Social media advertisements are another pay to promote section, but in this case you’re paying to have popups reminding your customers that they’ve purchased from you and a review would be nice. This can border on the level of “knowing too much”, but most consumers these days know all about big data and won’t be fazed by it.

What is Product Category Analysis?

Product category analysis is a catch-all term, referring to any analysis of product categories that you carry out in order to understand what drives purchases. Starting with an overview of product categories, you parse through the data in order to glean more insight using techniques such as product development analysis and operations analysis, alongside competitor analysis and customer experience analysis.

[banner_text text=”See Revuze’s platform in action” button_text=”Book a demo” button_link=”https://www.revuze.it/book-a-demo/”]


Product category analysis isn’t a simple thing that just anyone can do, as it requires careful interpretation of the data and even data cleaning in order to get the most relevant results. The analysis must be automated by a computer due to the sheer volume of data.

Category Blog Infographic

Why You Should Use Product Category Analysis

Product category analysis can give you deep insights into how your products are faring in the current market, from the individual level all the way up to the category level. It condenses high volumes of data down into easy to digest forms for use, meaning you’ll be able to tell what’s happening at just a glance.

The analysis brings insight on various factors, and you can focus on one particular area that you think needs improving to gather, say, a product category attractiveness analysis. With the reports such an analysis produces you can easily compare your brand to your competitors, spot areas that could be improved and also identify your strongest products.

Product category analysis can answer key questions you have about the state of your business, such as:

  • Who is/are my main competitor(s)?
    This one might seem obvious but there are always those that you can miss.
  • What products do my competitors sell?
    Following on from the above, you can compare your products to theirs and see what areas they outrank you in and need to look to improve.
  • What is the range of products offered within the category?
    Given a certain category, are you a standout or simply one among many? Is there a niche or a gap that you could potentially fill?
  • What do your customers think about you?
    Customer experience and subsequent opinion drives returning customers and is a big factor in new sales. If you’re not getting the reach you want on a product, you need to invest more in advertisement.

Category Blog Infographic

What Are The Stages of Product Category Analysis?

Product category analysis is a step-by-step process, one in which you should complete each step as thoroughly as you can before moving on to the next.  What you need to do at the beginning is simple — define your category. Some categories are subdivisions of others, resembling a tree structure or expanding flow chart.

Defining Data Requirements

Category analysis begins with data, and the more specific your data the more specific the results. What data you use is up to you and your goals, do you want to analyze on a monthly basis? Quarterly? In a general sense you can define your data requirements by asking yourself the following questions:

  • What sources will you use, internal or external to your business?
  • What time period are you looking at?
  • How often do you want to collect data during that time period?
  • What other brands are you looking at for comparison?
  • What information do you want to see in the report?

While the first four are easy to decide, the last question might be a bit tricky if you’re first starting out. Beginning with general analysis and moving on to more specific trends can help if you’re not sure where your problems lie.

Collecting Your Data

Once you’ve defined what data you’re looking at, the next step is to collect it. Where this data comes from will vary depending on what platforms you use to collect it, e.g. social media, emails, website reviews etc. Any data you have stored can be used at this point.

You can also use website scraping tools to collect the useful information from other online sources such as forums or open databases, however your tool needs to be aware of sentiment analysis in order to properly interpret the data.

Processing the Data

Any data you gather is going to be disorganized at first, meaning without any standardized format. Your next step is to convert the data into a singular format that can be easily read, grouping the data such that information on specific products is together and so on. 

Topics and sub-topics can be used here, with some subcategory reviews having some relevance to the parent category as a whole and vice-versa. 

Cleaning the Data

When you obtain raw data, it’s not going to be what is referred to as “clean”. Essentially, you’re going to have incorrect formats, duplicates, errors, white spaces and such that will mess with your analysis and leave you with incorrect analysis. There’s also the factor of irrelevant information, in this case meaning information not related to what you want to see in the report, which should also be removed.

Data cleaning should always be performed before any analysis is done.

Data Analysis

Once your data is cleaned, you’re ready to analyze it. This is done through various mathematical models and formulae, also known as algorithms. Which algorithm you use is entirely up to you, but there are a few common ones that are aimed at customer satisfaction. These include:

  • MoSCoW
    A prioritization algorithm that splits factors based on their desirability, with must-have, should-have, could-have and won’t-have categories.
  • Kano
    An algorithm that splits factors into five “drivers”, from those that are taken for granted to those that consumers are completely indifferent on.
  • Eisenhower Matrix
    Another prioritization algorithm that sorts factors into urgent/not urgent and important/not important categories, allowing you to focus on the most time-sensitive issues.

Compiling Your Report

The final stage is converting the output into a readable form, usually into a report with graphs and charts for ease of reading. Spreadsheets and presentations are also widely used. The key aim of the report is to present category drivers.

Category drivers are the factors that help you understand what would cause a customer to use your product and what barriers exist that might prevent them from doing so. The ultimate goal of this analysis is, after all, to understand how to boost your sales. Category trends and insights based on them can also be found.

Sentimate Case Study: Drones

With our product insights engine Sentimate, you can use our product and category analysis tools to gain great insight into whatever category you wish. There’s no need to collect data, sort it, analyze it etc., we’ve done it all for you and have it ready to present in an easy to read format.

Category Blog Infographic

With that in mind, let’s look at a fun and interesting category, drones.

Sentimate lets you see the top products in a category and any new launches that have recently been released, as well as rising stars that have had a high increase in customer sentiment.

There’s also our competitive landscape tool, which lets you analyze either the top ten products or top ten brands within a category in any given month, comparing them on a chart of customer sentiment vs verified review volume. Using this, you can the category leaders and have links right to their product pages for further, individualized analysis.

Screen Shot at PMThe above is real data taken from our product insights engine, showing the top ten products in the Drones category for April 2022. 

Looking at the chart on the right hand side, you can clearly see that the DJI Mini 2 Fly More Quadcopter is a leader in both review volume and consumer sentiment, indicating that it is both a top-seller and a high quality product. 

Over on the left hand side, you can see the Maetot 1080P HD Camera Quadcopter, which while not having as great a number of reviews has a higher overall customer sentiment. This can be an indicator of a more specialized, high quality product, that while overall makes less sales will make up for it by having a higher price tag.

Using the individual product analysis tools you can track backwards across time, seeing where products stand on an individual level as well as how they have improved or not instanding over time for a more detailed analysis. You can track a product’s SWOT, compare it to others in its category and even see the top drivers and star ratings analysis.

There’s also the product map, offering a comparison of the individual product’s consumer sentiment vs the average of the category, topics of discussion and where the product fares in each of them. Our product topic map sets out these topics, both positive and negative, in an easy-to-read format that correlates the amount of chatter a particular topic has with the area it takes up on the map. Below you’ll find the product topic map for the DJI Mini 2 Fly More Quadcopter, arguably the number one product in the Drones category right now.

Category Blog Infographic

What Kind Of Data Can Be Used?

Data comes in all shapes and sizes, and the more channels you have available to gather said data the more informative it’s going to be. Some of the main sources of data include:

  • Sales reports
  • Customer emails
  • Chatbot logs
  • Customer surveys
  • Social media posts
  • Forum posts

While some might be more relevant than others, all data that you can gather will be useful providing it passes through the data cleaning process. 

What Do You Get Out Of Product Category Analysis?

What information you get out of your product category analysis depends entirely on what you put in. That being said, there are a few key pieces of information that you will always get to some degree

  • Category Trends
    Category trends refers to any information on trends of customer behavior towards a certain category. Emerging trends that customers want to see, things that turn them away and add-on options that boost sales are all examples of such trends.
  • Category Drivers
    Category drivers are anything that prompts consumers to buy specific products when compared to alternatives. What these are will depend entirely on the category in question, but a good example would be the iPhone vs Android rivalry and which side a consumer stands on.
  • Consumer Beliefs
    Consumer beliefs can be tricky. Not only are they specific to an individual but they can vary wildly across different locations. That being said, generalizations can be useful, with one example being the public’s aversion to 5G towers and thus any 5G technology. Remember, it doesn’t have to be true for consumers to believe it, and that which is perceived to be true is often just as important or more so as what actually is.
  • Brand Equity
    Brand equity is a measure of your brand’s performance, specifically its performance in the public markets. It’s essentially the boost that a brand receives due to being well known, and therefore the worth of the brand name itself. A great example of this is Coca-Cola, who have a great brand equity when compared to a generic brand of the soft drinks industry. If you have high brand equity, your brand is trusted.

With the above in mind, there’s plenty of insights that we can gain from product category analysis, forming the basis for your strategies moving forwards. While these aren’t an exhaustive list, a few of them are:

  • Product improvements
  • Promotion/Advertisement strategies
  • Positioning strategies
  • Price adjustments
  • Finding market gaps
  • Learning which features of your products to emphasize
  • Altering your business Model
  • Finding new distribution channels
  • Expanding production/processing

Conclusion

Product category analysis is a tricky and time-consuming thing to perform, with thousands of individual pieces of data needed in order to get a complete picture of any one product, never mind an entire product category. 

Fortunately, Sentimate is here to help. Sign up for free today to access instant insights into products of all shapes and sizes.

[banner_text text=”Read our market report on the Apple AirPods Max” button_text=”Download the report” button_link=”https://www.revuze.it/resources/apple-airpods-max-one-year-later/”]