 All
Articles
All
Articles Email
Analytics
Email
Analytics

Florence Broder


Whether you’re a marketing professional or in innovation, understanding your brand’s position in the marketplace is imperative. Are you a product leader that has to protect itself from upcoming brands? Or are you the new kid on the block looking to take a piece of the pie away from someone else?
Online review analytics can provide unparalleled insights into the long-term trends and emerging ones. Revuze’s AI slices and dices the consumer feedback to ensure the highest degree of data accuracy around topics and sentiment analysis. The array of dashboards in Explorer quickly gives you a snapshot of all the category insights that matter to ensure your company attains its business goals.
1. Your Brand’s Popularity
The magic of online reviews is that the data is priceless. Keep in mind that it’s post-purchase data from consumers who are willing to write about their experience with your brand and/or product. Their viewpoint can make or break your brand, encouraging or discouraging potential customers from completing their purchase.
The volume of consumer reviews can help brands understand their position in the marketplace. For instance, the screenshot below shows the share of voice and consumer sentiment for brands in the Tops fashion category. Adidas is leading with over 36,000 reviews and a high consumer sentiment. Here, you can quickly assess who the dominant players are in the category and learn which competitors are investing more in incentivized reviews. Notably, 90% of The North Face’s reviews are incentivized, followed by Nike at 58%.
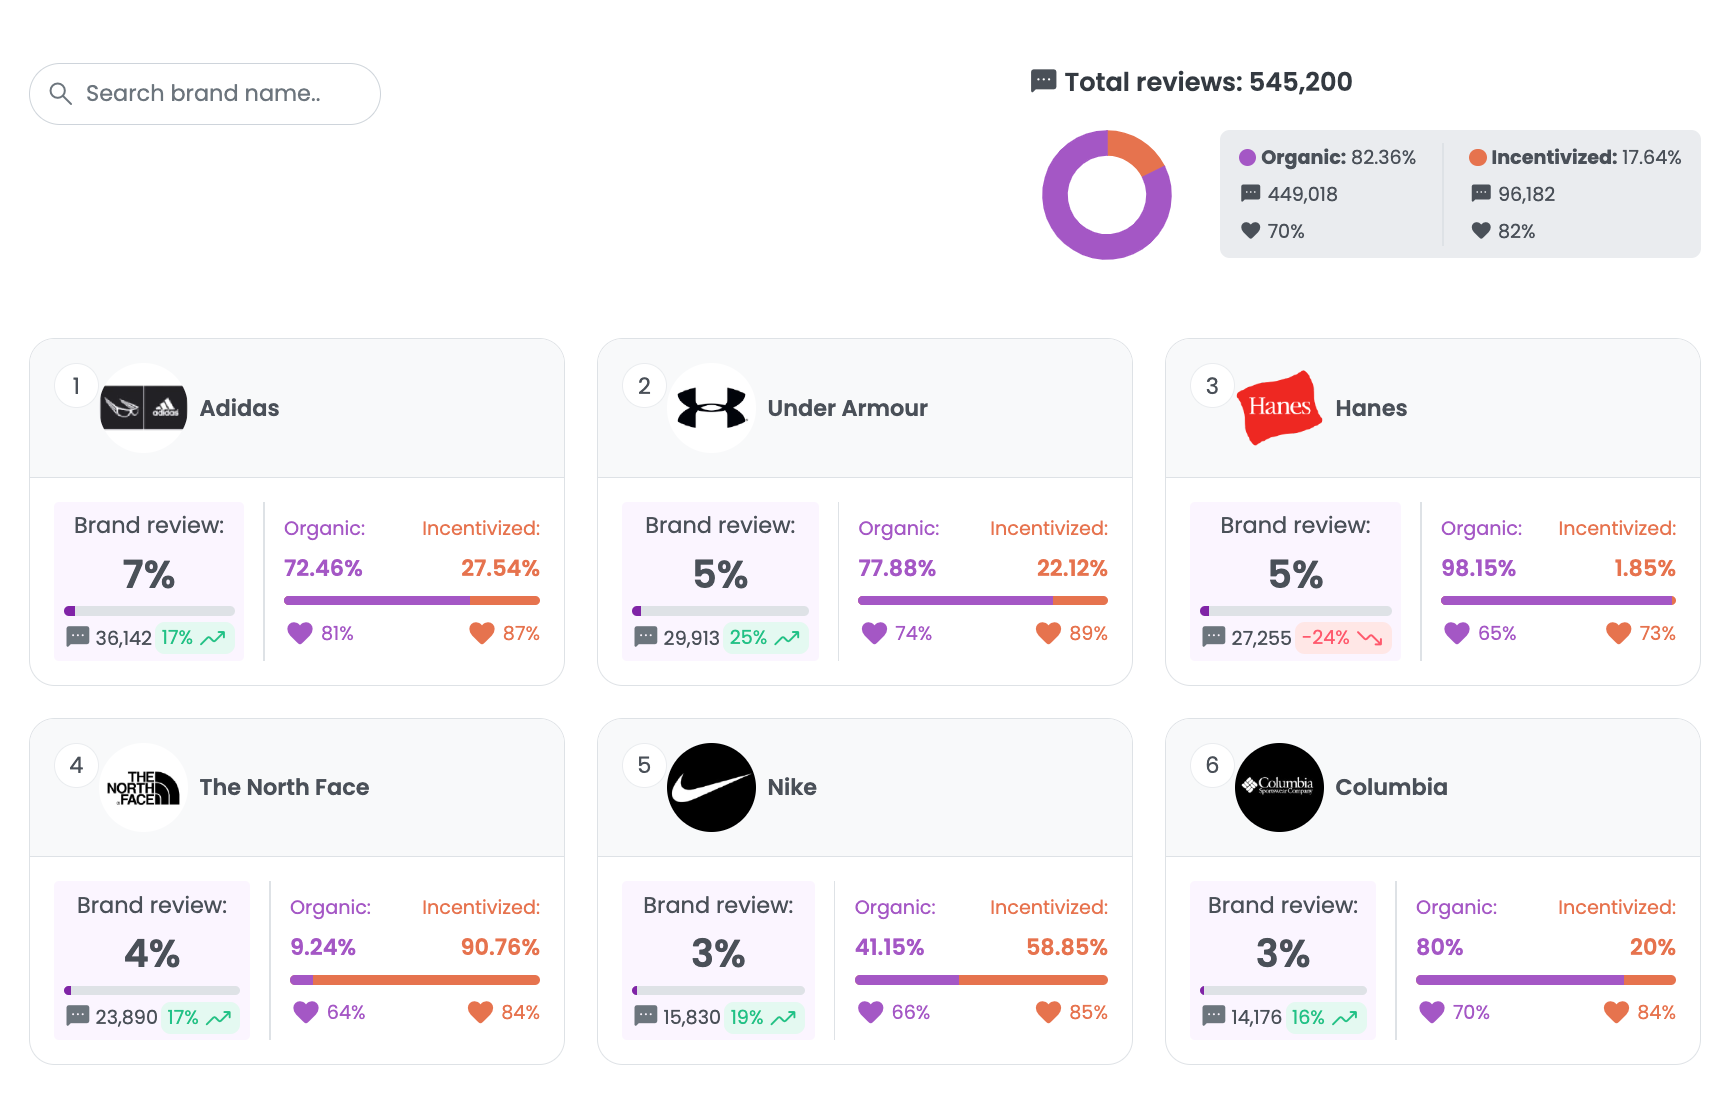
This data can help get the creative juices flowing. Is your brand in the top eight places when it comes to discussion volume? If not, why isn’t your brand appearing; is it a marketing or product challenge? Should you consider investing in more incentivized reviews? This top level data will help point you in the right direction as you decide where you want to get more granular.
2. Brand Discussion Trends
In the previous section we showed how Revuze helps give brands a sense of their overall position in a specific category. However, there are other important metrics that are worth noting as well. One of them is the velocity in which reviews are added during a specific timeframe.
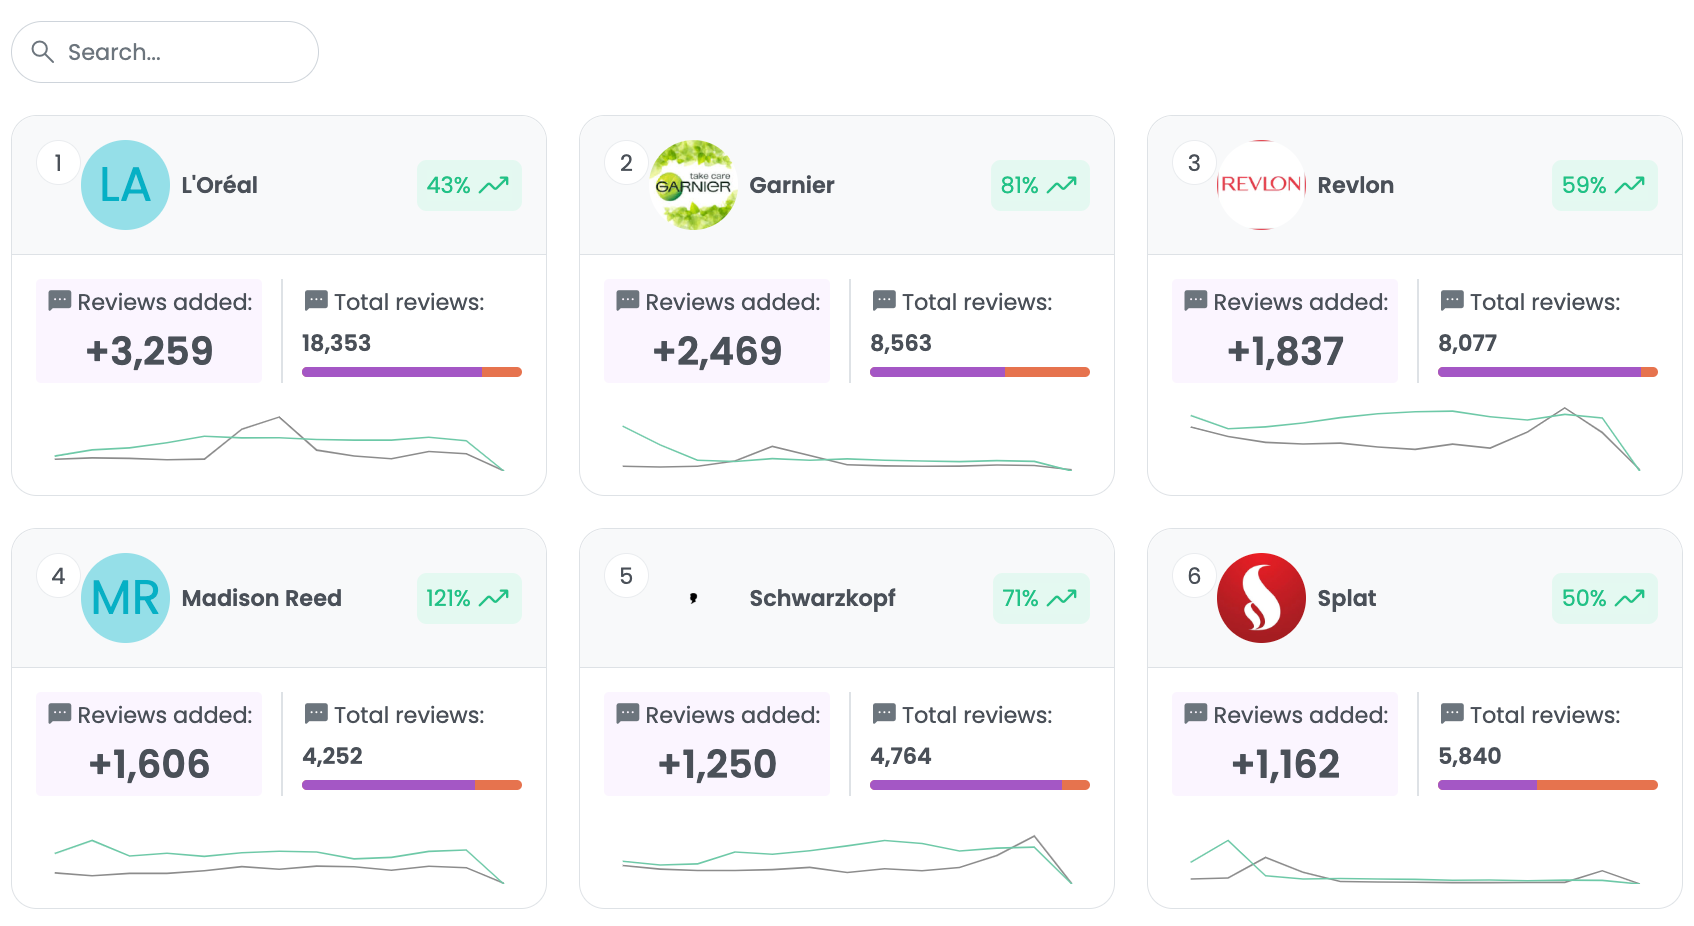
This overview gives an indication that consumers are buzzing around something regarding a brand. At this point we don’t know if the buzz is good or bad, but rather there is a definite trend that should be explored further. In this screenshot, we’re looking at which brands are trending in the hair color category. In this case, almost 1606 additional reviews are discussing the Madison Reed brand, representing an overall increase of 121%. A similar number of reviews are discussing Revlon’s hair color, but it represents a 59% increase. The absolute number and the percentage of are important indicators to evaluate your brand across the category insights.
As you assess the numbers, think about the competitors that are worth exploring. Was a new product launched that has consumers talking? Or perhaps, a brand recently changed their product’s formula or ingredients and consumers aren’t happy about it? Did a competitor launch a new marketing campaign? How can you capitalize on your competitor’s dissatisfied customers so your own brand comes out on top? As you grapple with these business questions, you’ll navigate the dashboards to get more granular.
3. Comparing Consumer Sentiment Overtime
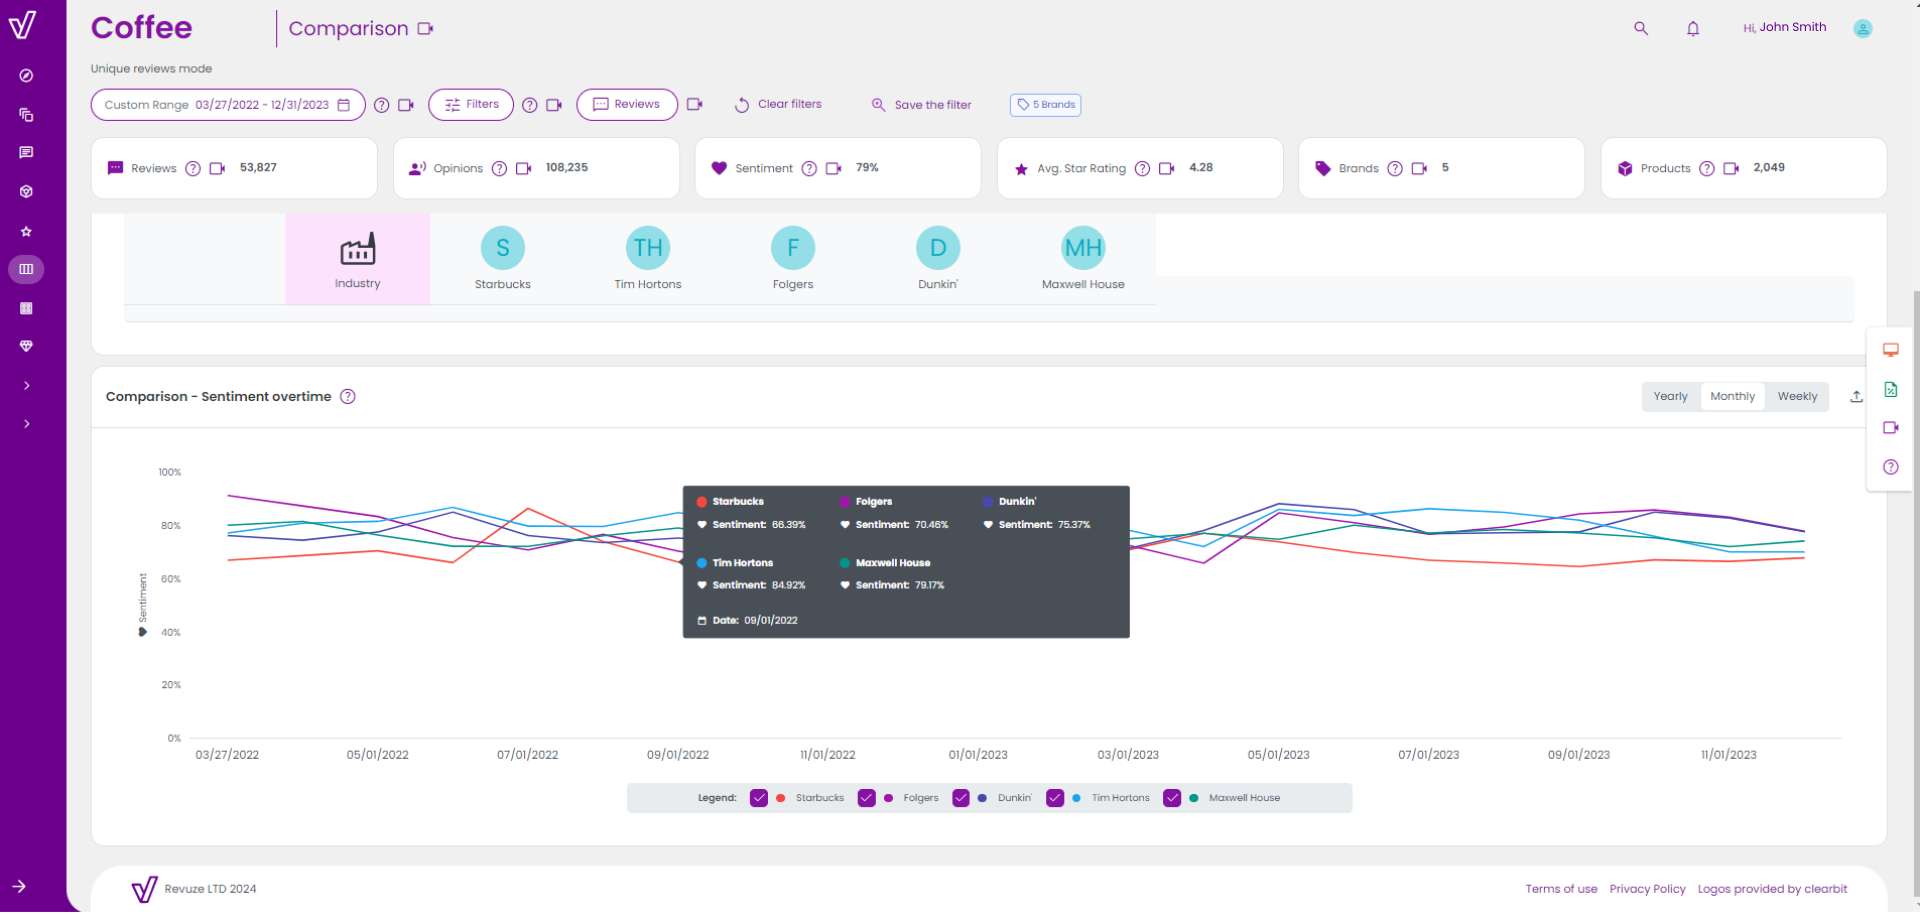
It’s often the case that you want to see your brand positioning against other one or more primary competitors. Revuze’s Comparison dashboard makes it easy for you to see your brand and your competitors’ consumer sentiment has fluctuated over time. The graph below highlights the consumer sentiment of five leading coffee brands in the US over a three year period. We see that Starbucks’ sentiment is on decline when compared to other leading brands. Play with filters to adjust the time frame. If you’re planning a new marketing campaign or product changes, you might consider delving into competitors’ data to see what caused the dips and peaks in consumer sentiment.
4. Benchmarking by Source
As you allocate resources to different online retail channels, understand how your brand’s consumer sentiment aligns with primary competitors. Is your brand’s sentiment higher or lower on a specific channel when compared to key rivals? What are some of the factors influencing sentiment on each channel?
In this example, we are benchmarking consumer sentiment across the blender industry plus three additional brands. (With Revuze, you can benchmark two-eight brands at once!) We’re able to get very granular to compare consumer sentiment for different e-commerce channels. Here we’re looking at the sentiment of three blender brands on Amazon, Macy’s, Target, and Bed, Bath and Beyond. It quickly captures how the Ninja has positive sentiment, 67%, on Amazon. Vitamix’s sentiment is neutral at 65% but close to the Ninja brand despite the disparity in review volume. Note how Ninja have negative consumer sentiment on a number of channels. 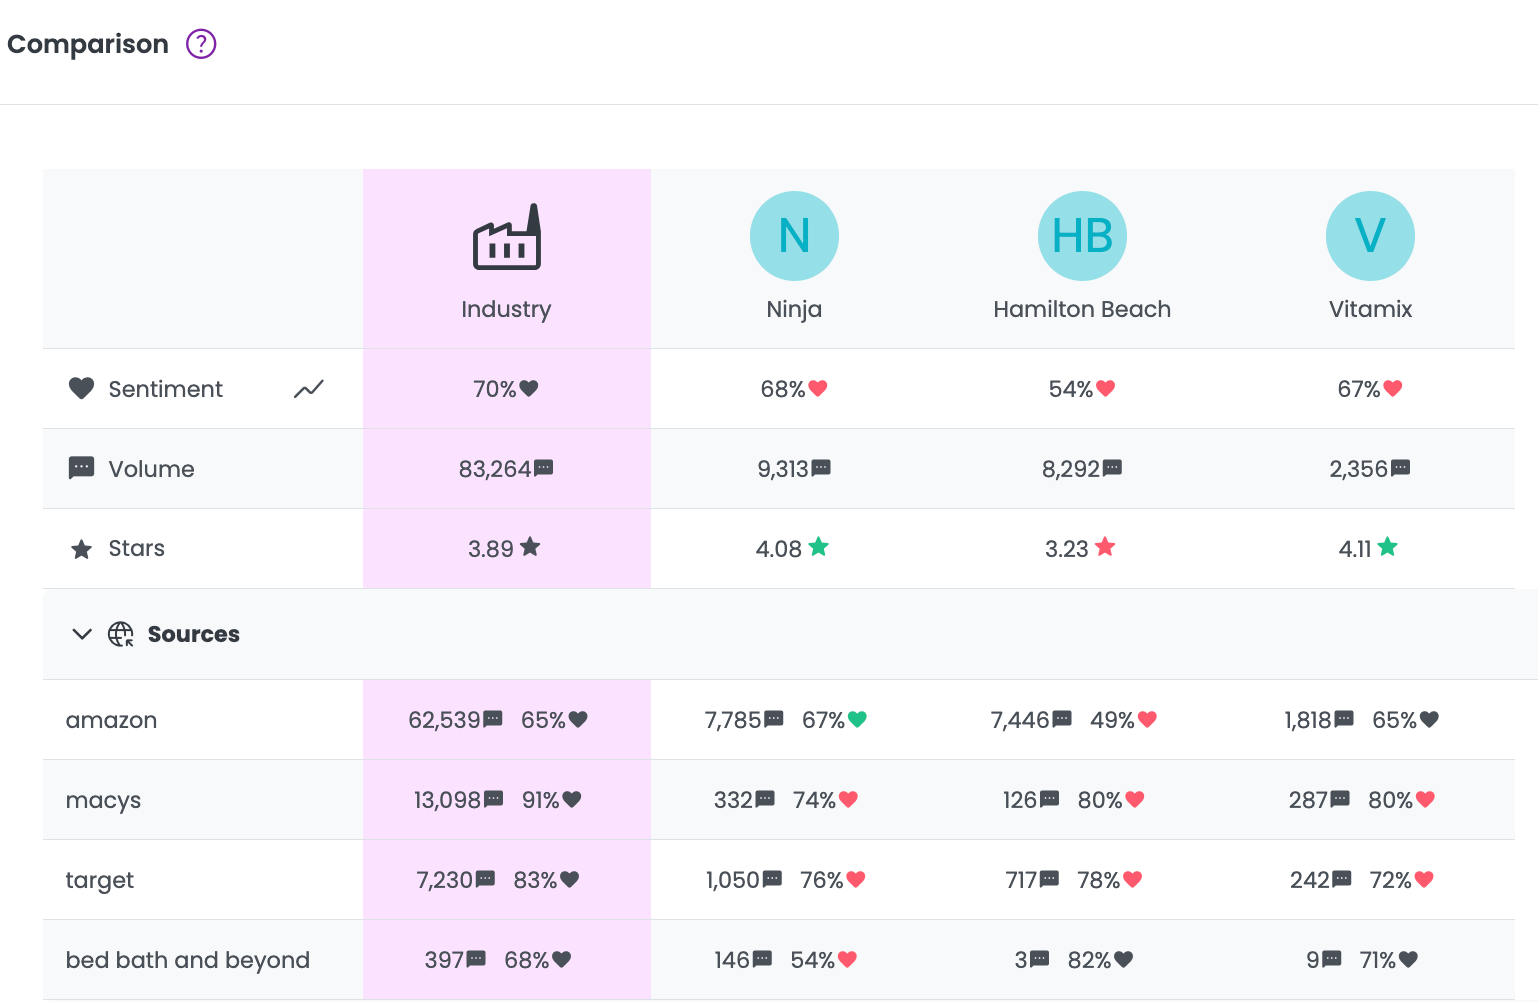
Marketers who arm themselves with this data can use it to optimize their different e-commerce channels. This is the time to ask: Why is review sentiment higher on Amazon when compared to the other channels? Start exploring the product description pages on each channel to understand what differences are influencing consumer sentiment.
5. Benchmarking by Topic
We covered a couple of aspects of sentiment analysis already. First, we looked at sentiment overtime and we also looked at sentiment by source, or online retail channels. They paint a specific picture of the category landscape for your industry. Another important facet is looking at sentiment for each topic or product attribute.
When consumers leave reviews, they don’t necessarily focus on one aspect of a product. In fact, they can discuss a number of topics around a product from quality, ingredients, or price. Revuze’s AI parses out the topics from the consumer reviews and performs a sentiment analysis for each topic. A brand or product can have high sentiment for one topic but low sentiment in another signifying further investigation.
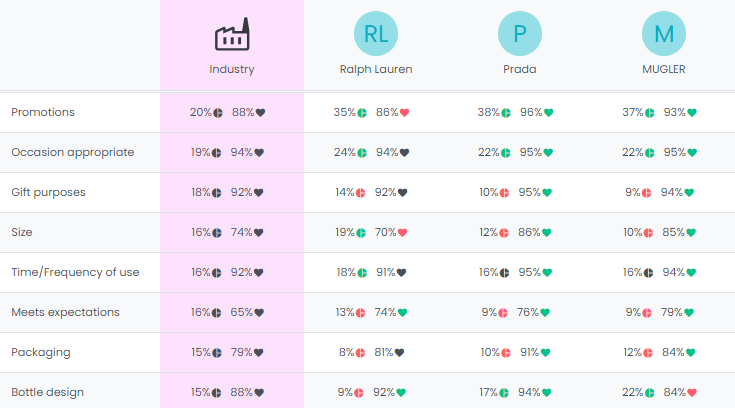
In the screenshot below, we’re comparing three leading fragrance brands by topic against the entire industry. For instance, Ralph Lauren has high sentiment around “Bottle” and “Meets Expectations” but low sentiment for “Promotion”. If you work for Thierry Mugler, you might want to get to work on “Bottle Design” and understand if it’s related to a specific fragrance product or all of them. Another way to use the data to understand competitors’ positions. Prada scored 86% sentiment for the “Size” topic well above the industry average of 74%.
Conclusion
For this post, we looked at a cross-section of industries to highlight how Revuze Explorer can be maximized to understand your brand’s position across a category. Whether we’re looking at apparel, appliances, food and beverage, cosmetics, or personal care, it’s easy to understand a competitor’s position. Use the competitive data to your advantage to overtake dominant players and optimize your brand’s own positioning. Whether you’re launching a new product, cooking up a marketing campaign, or optimizing your online retail channels, you can find everything you need in Revuze’s category insights. To learn more about online review data click here.

 Agencies
Insights
Agencies
Insights